Market Outlook
The weekly chart remains in consolidation, with the daily chart revealing internal structure developing within a larger framework. Both buy-side and sell-side liquidity remain untapped. The most recent daily candle printed a doji, clearing prior liquidity and trading directly into a daily Optimal Trade Entry (OTE) zone — highlighting an area of interest for potential reversal.
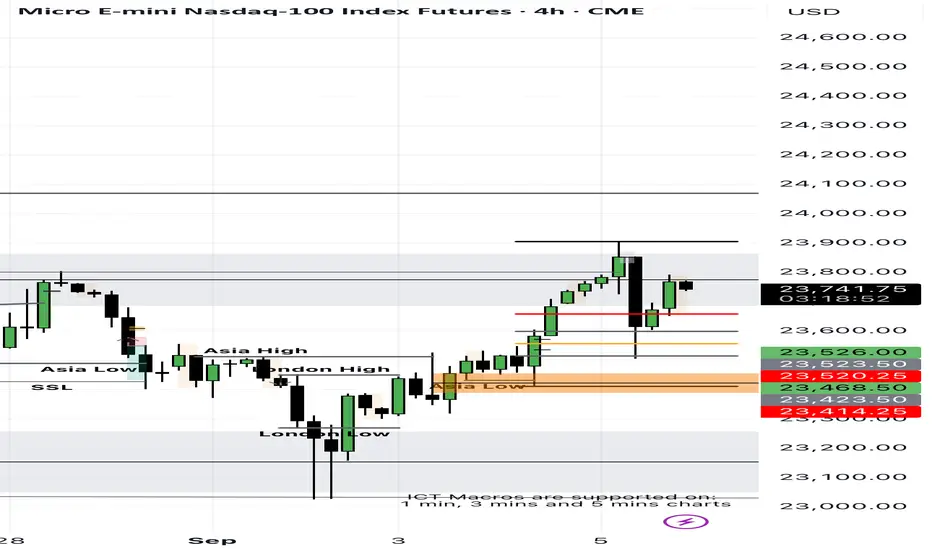
On the four-hour chart, clean sell-side liquidity is visible at 23,019, and the last four candles have established a bearish Fair Value Gap (FVG) within the daily OTE zone.
While the broader order flow still supports a buying program, my long-term bias is for a downside move. Until a valid reversal confirms, I will continue trading intraday longs. A shift to short setups will require the four-hour bearish FVG to hold and be validated as a point of resistance.
The weekly chart remains in consolidation, with the daily chart revealing internal structure developing within a larger framework. Both buy-side and sell-side liquidity remain untapped. The most recent daily candle printed a doji, clearing prior liquidity and trading directly into a daily Optimal Trade Entry (OTE) zone — highlighting an area of interest for potential reversal.
On the four-hour chart, clean sell-side liquidity is visible at 23,019, and the last four candles have established a bearish Fair Value Gap (FVG) within the daily OTE zone.
While the broader order flow still supports a buying program, my long-term bias is for a downside move. Until a valid reversal confirms, I will continue trading intraday longs. A shift to short setups will require the four-hour bearish FVG to hold and be validated as a point of resistance.
Disclaimer
The information and publications are not meant to be, and do not constitute, financial, investment, trading, or other types of advice or recommendations supplied or endorsed by TradingView. Read more in the Terms of Use.
Disclaimer
The information and publications are not meant to be, and do not constitute, financial, investment, trading, or other types of advice or recommendations supplied or endorsed by TradingView. Read more in the Terms of Use.