NASDAQ (MNQ) SHORT SETUP 15M📉 15-Minute Timeframe
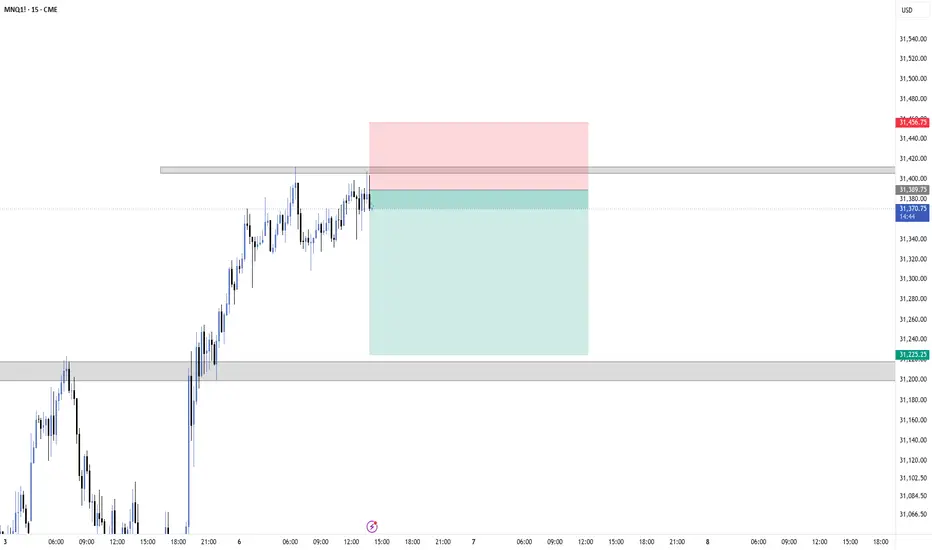
Entry: 31,382.75
Stop Loss: 31,456.75
Take Profit: 31,225.25
Risk/Reward: ~1:2.1
Price is approaching a strong supply/resistance zone around 31,400–31,410. Looking for bearish rejection from this area and continuation toward the lower demand zone.
Trade Plan:
🔴 Short fro
Micro E-mini Nasdaq-100 Index Futures
No trades
No trades
Compare with Micro E-mini Nasdaq-100 Index Futures
NASDAQ 15M — Short SetupTitle: MNQ1! 15M | Short Setup 🎯
Description:
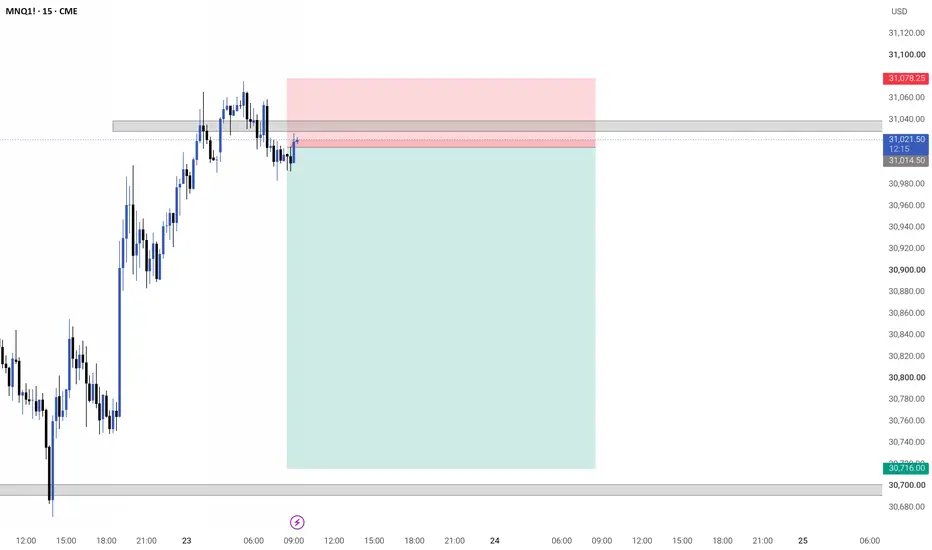
MNQ is showing a potential short setup after rejecting the upper resistance/supply zone.
📍 Entry: 31,019
🛑 Stop Loss: 31,078
🎯 Target: 30,716
📉 R:R: ~1:5
Price is consolidating below the resistance area. Watching for bearish continuation toward the l
Wave Geometry: Revealing Hidden Market StructureMost traders analyse each timeframe independently.
What if the lower timeframe is simply a mathematical projection of the higher timeframe wave?
In Trading Truth Concepts, I start by identifying the primary wave on a higher timeframe—for example, the 4-hour chart. That wave becomes the reference s
31/05/2026 NQ AnalysisCME_MINI:NQ1!
This is my NQ analysis for Monday.
My expectation is for NQ to retrace into its 4H FVG, engineer a liquidity sweep, and then continue higher into the buy-side liquidity.
However, if Sunday’s 6:30 PM ET open creates either a significant gap up or gap down, the scenario will be diff
Important idea with our KGS CPR indicator
Here is an important idea from our KGS CPR indicator.
Intraday traders can find out where the morning is going to move and BTST also we can do
In a trading day where ever the candle is, it moves towards the next day CPR. I have attached an image just go through that for ur confirmation and give a
Bearish Continuation After Resistance RejectionHi Everyone,
NQ is trading within a well-defined downtrend. Price retraced into a key resistance zone and printed a strong rejection, indicating sellers are still in control. As long as price remains below resistance, further downside is expected.
Ibrouri Abdessamad
Following the Flows: Beta-Hedging around Nasdaq RebalancingRebalancing can create some of the most predictable flows in equity markets. When an index changes the weights of its constituents, funds tracking it must buy and sell the affected stocks to stay aligned with the benchmark. Those adjustments can influence prices, particularly for companies seeing th
See all ideas
Summarizing what the indicators are suggesting.
Neutral
Neutral
Neutral
A representation of what an asset is worth today and what the market thinks it will be worth in the future.
Displays a symbol's price movements over previous years to identify recurring trends.
Frequently asked questions
The current price of Micro E-mini Nasdaq-100 Index Futures is 31,108.75 USD — it has risen 0.45% in the past 24 hours. Watch Micro E-mini Nasdaq-100 Index Futures price in more detail on the chart.
The volume of Micro E-mini Nasdaq-100 Index Futures is 2.14 M. Track more important stats on the Micro E-mini Nasdaq-100 Index Futures chart.
Open interest is the number of contracts held by traders in active positions — they're not closed or expired. For Micro E-mini Nasdaq-100 Index Futures this number is 140.66 K. You can use it to track a prevailing market trend and adjust your own strategy: declining open interest for Micro E-mini Nasdaq-100 Index Futures shows that traders are closing their positions, which means a weakening trend.
Buying or selling futures contracts depends on many factors: season, underlying commodity, your own trading strategy. So mostly it's up to you, but if you look for some certain calculations to take into account, you can study technical analysis for Micro E-mini Nasdaq-100 Index Futures. Today its technical rating is buy, but remember that market conditions change all the time, so it's always crucial to do your own research. See more of Micro E-mini Nasdaq-100 Index Futures technicals for a more comprehensive analysis.