Two Precision Setups for a Major Move | Breakout vs. Rebound
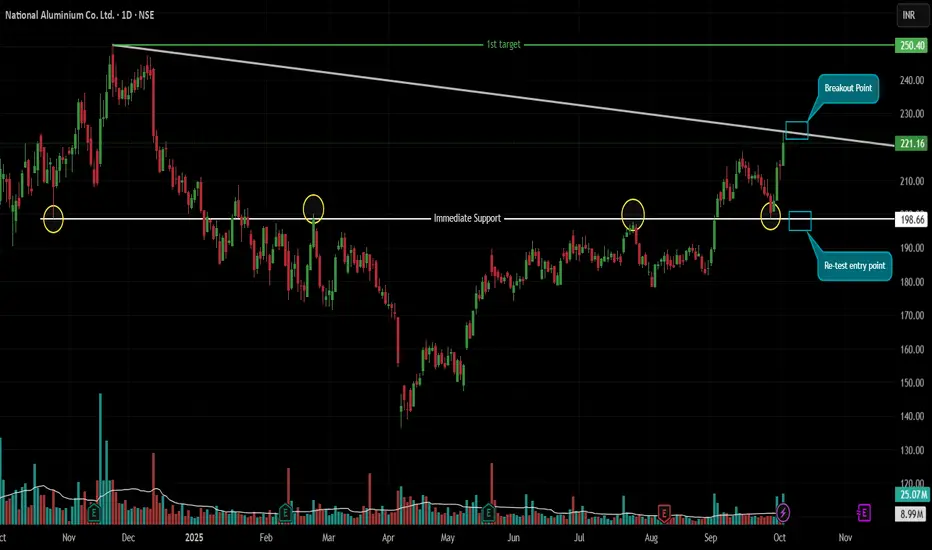
Chart: NSE:NALCO | Daily Timeframe
📈 Executive Summary:
Nalco Ltd. is at a technical crossroads, compressed between a massive 12-month descending trendline and a rock-solid multi-touch support zone. This creates two high-probability, well-defined trading opportunities for both momentum and value traders. The key for both setups will be confirmation with above-average volume.
🔥 Scenario 1: The Mega Breakout (Momentum Play)
This setup capitalizes on a decisive shift in long-term trend dynamics.
The Structure: A dominant Descending Trendline connects the November 2024 high (₹250) with the recent October 2025 high (₹225). This line has contained all major rallies for nearly a year.
The Trigger & Confirmation: A strong, 'big green' daily candle that closes decisively above ₹225. This move must be supported by above-average volume to confirm genuine buying interest and not a false breakout.
The Logic: A breakout from such a long-standing consolidation has the potential to unleash significant pent-up momentum, targeting the previous major high.
🎯 Trading Plan (Breakout):
🎯 Entry: On a daily close above ₹225, confirmed by above-average volume.
⛔ Stop Loss: Low of the breakout candle. This pragmatic level protects against a false breakout and allows for a tight, logical risk definition.
🎯 Target: ₹250 (The origin point of the trendline, acting as a logical and psychological target).
⚖️ Risk-Reward: Highly favorable, estimated above 1:3.
🛡️ Scenario 2: The Support Bounce (Value Play)
This is a classic "buy low, sell high" strategy at a proven demand zone.
The Structure: The ₹199 level is a historic support and resistance zone, tested multiple times since October 2024. It currently acts as a strong support floor.
The Trigger & Confirmation: The price must retrace and hold the ₹199-202 zone and then form a clear bullish reversal candlestick pattern (e.g., Hammer, Bullish Engulfing) with above-average volume on the daily timeframe.
The Logic: Entering at a proven support level with a candlestick confirmation provides a high-probability entry with an excellent risk-to-reward profile.
🎯 Trading Plan (Support Bounce):
🎯 Entry: On the confirmation of the bullish candlestick pattern (e.g., a close above the high of the pattern's candle) in the ₹199-202 zone, with volume confirmation.
⛔ Stop Loss: Low of the identified reversal candlestick pattern. This minimizes risk by invalidating the setup if the support fails immediately.
🎯 Target 1: 1:1 Risk-Reward Level (e.g., if risk is ₹5, target is Entry + ₹5).
🎯 Target 2: ₹225 (The recent swing high and trendline resistance). Once Target 1 is hit, trail the stop loss to lock in profits and ride the move towards ₹225.
Key Levels At a Glance:
All-Out Resistance: ₹225 (The 12-Month Trendline)
Foundational Support: ₹199 (The Multi-Touch Zone)
Breakout Target: ₹250
Support Bounce Target: ₹210-225
Final Note: Both setups require patience and discipline. Wait for the specific trigger and volume confirmation. Do not pre-empt the trade.
Disclaimer: This idea represents a technical analysis perspective and is not financial advice. All trading decisions carry risk. Please perform your own due diligence.
Disclaimer
The information and publications are not meant to be, and do not constitute, financial, investment, trading, or other types of advice or recommendations supplied or endorsed by TradingView. Read more in the Terms of Use.
Disclaimer
The information and publications are not meant to be, and do not constitute, financial, investment, trading, or other types of advice or recommendations supplied or endorsed by TradingView. Read more in the Terms of Use.