Tech Stocks Rally After Nvidia’s Earnings Report
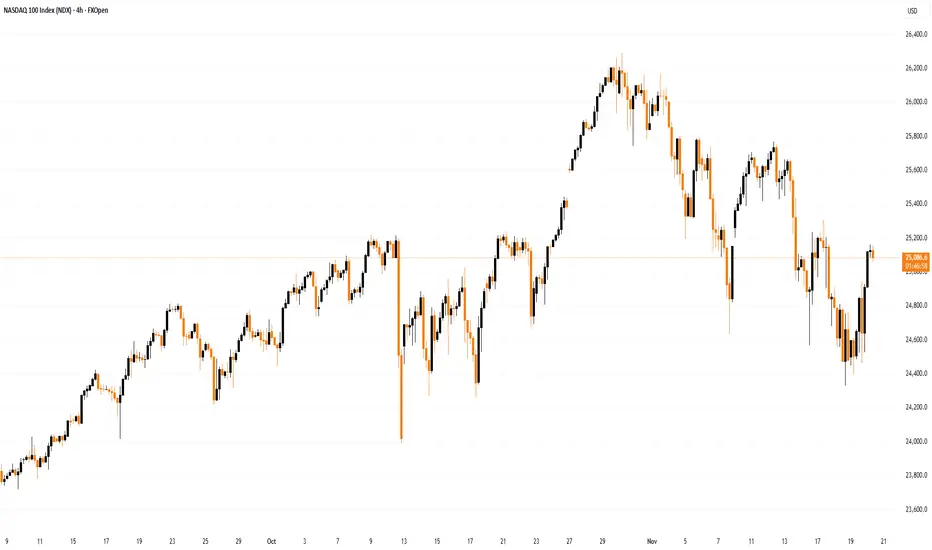
As the chart shows, the Nasdaq 100 index is displaying positive momentum today. A strong catalyst for growth arrived with the release of Nvidia’s quarterly report, which exceeded Wall Street’s optimistic expectations.
Nvidia reported quarterly revenue of $57bn (vs. the expected $54.9bn), and earnings per share of $1.30 (forecast: $1.26). Meanwhile, CEO Jensen Huang stated that demand for the new Blackwell chips is “off the charts”.
Nvidia’s strong report revived “risk appetite” in the tech sector and eased concerns about a potential AI bubble.

Technical Analysis of the Nasdaq 100 Chart
Analysing the hourly chart of the Nasdaq 100 two days earlier, we:
→ noted that the previously active upward channel had broadened downwards;
→ suggested a scenario in which the bulls might attempt to return the index to an upward trajectory if Nvidia’s quarterly results were strong.
Yesterday’s report from the equity market leader confirmed that demand for artificial intelligence infrastructure remains enormous, paving the way for the tech-sector rally to continue.
From the standpoint of supply pressure, resistance may come from:
→ the upper red line drawn through the lower November highs;
→ the 25,400 level, which had acted as local support but was decisively broken by a large bearish candle.
On the other hand:
→ the decline towards 24,400 once again activated buying interest;
→ the November drop may prove to be only an intermediate correction, after which the upward trend could resume.
Whether the bulls can maintain positive momentum in the Nasdaq 100 following Nvidia’s strong quarterly figures will depend largely on the outcome of the delayed September US employment report, postponed due to the shutdown.
This article represents the opinion of the Companies operating under the FXOpen brand only. It is not to be construed as an offer, solicitation, or recommendation with respect to products and services provided by the Companies operating under the FXOpen brand, nor is it to be considered financial advice.
As the chart shows, the Nasdaq 100 index is displaying positive momentum today. A strong catalyst for growth arrived with the release of Nvidia’s quarterly report, which exceeded Wall Street’s optimistic expectations.
Nvidia reported quarterly revenue of $57bn (vs. the expected $54.9bn), and earnings per share of $1.30 (forecast: $1.26). Meanwhile, CEO Jensen Huang stated that demand for the new Blackwell chips is “off the charts”.
Nvidia’s strong report revived “risk appetite” in the tech sector and eased concerns about a potential AI bubble.
Technical Analysis of the Nasdaq 100 Chart
Analysing the hourly chart of the Nasdaq 100 two days earlier, we:
→ noted that the previously active upward channel had broadened downwards;
→ suggested a scenario in which the bulls might attempt to return the index to an upward trajectory if Nvidia’s quarterly results were strong.
Yesterday’s report from the equity market leader confirmed that demand for artificial intelligence infrastructure remains enormous, paving the way for the tech-sector rally to continue.
From the standpoint of supply pressure, resistance may come from:
→ the upper red line drawn through the lower November highs;
→ the 25,400 level, which had acted as local support but was decisively broken by a large bearish candle.
On the other hand:
→ the decline towards 24,400 once again activated buying interest;
→ the November drop may prove to be only an intermediate correction, after which the upward trend could resume.
Whether the bulls can maintain positive momentum in the Nasdaq 100 following Nvidia’s strong quarterly figures will depend largely on the outcome of the delayed September US employment report, postponed due to the shutdown.
This article represents the opinion of the Companies operating under the FXOpen brand only. It is not to be construed as an offer, solicitation, or recommendation with respect to products and services provided by the Companies operating under the FXOpen brand, nor is it to be considered financial advice.
Disclaimer
The information and publications are not meant to be, and do not constitute, financial, investment, trading, or other types of advice or recommendations supplied or endorsed by TradingView. Read more in the Terms of Use.
Disclaimer
The information and publications are not meant to be, and do not constitute, financial, investment, trading, or other types of advice or recommendations supplied or endorsed by TradingView. Read more in the Terms of Use.