Henry Hub Natural Gas Future Weekly Analysis 10-14 June, 24
📈 Henry Hub Natural Gas Future Technical Chart Analysis
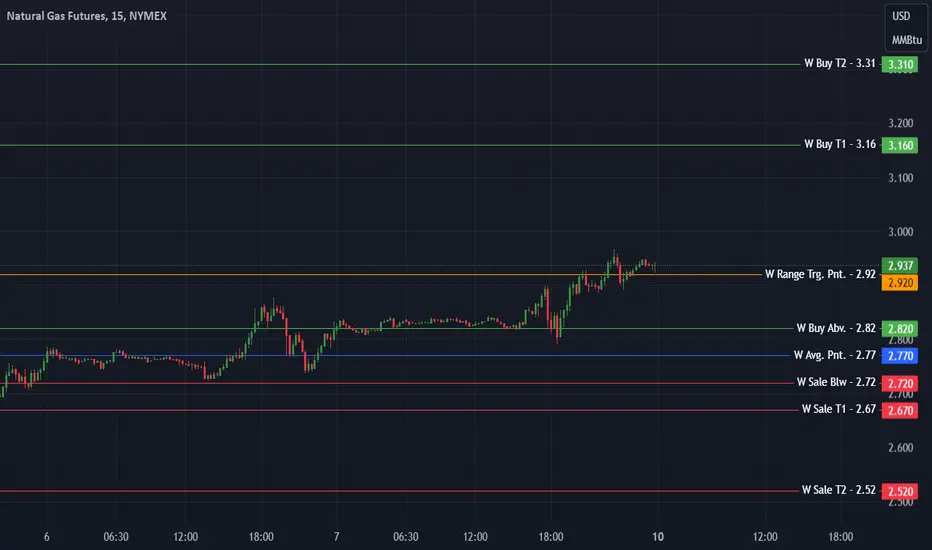
📆 Weekly Levels for 10-14 June, 2024:
📊 Weekly Movement Point: 2.92
📉 Weekly Range: 0.39
📈 Buy Above: 2.82
💼 Average At: 2.77
🎯 Buy Target 1: 3.16
🎯 Buy Target 2: 3.31
🛑 Buyer Stoploss: 2.69
💰 Sale Below: 2.72
🎯 Sale Target 1: 2.67
🎯 Sale Target 2: 2.52
🛑 Seller Stoploss: 2.85
✨ Boost, follow, and engage for more insightful updates. For detailed analysis and live discussions, check out our community channels. Your engagement fuels our dedication to providing top-notch content! 🚀❤️
#HenryHub #NaturalGas #GasFutures #CommoditiesTrading #MarketAnalysis #NG #GasPrices #NatGas #EnergyTrading #MCX #CommoditiesFutures #CommoditiesOptions
Disclaimer
The information and publications are not meant to be, and do not constitute, financial, investment, trading, or other types of advice or recommendations supplied or endorsed by TradingView. Read more in the Terms of Use.
Disclaimer
The information and publications are not meant to be, and do not constitute, financial, investment, trading, or other types of advice or recommendations supplied or endorsed by TradingView. Read more in the Terms of Use.