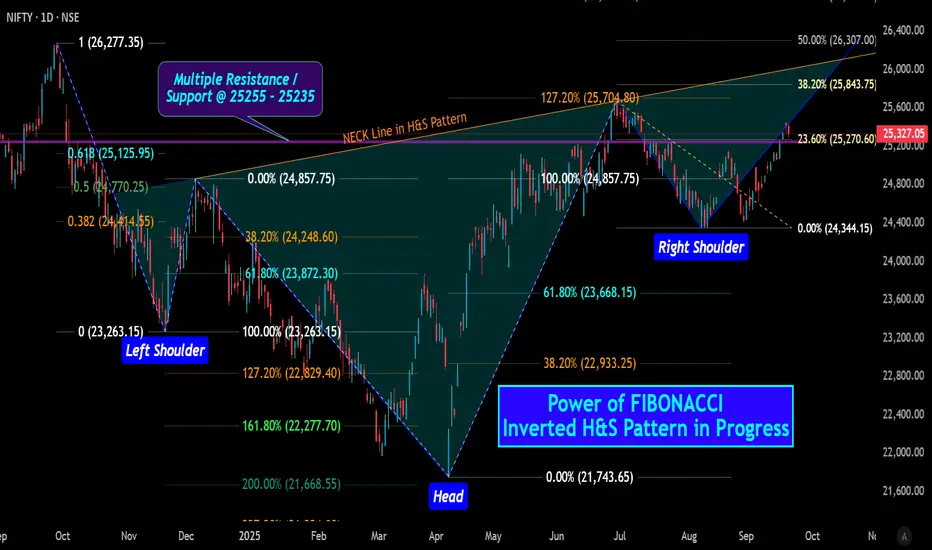
NIFTY: Power of FIBONACCI Inverted H&S Pattern in Progress
Overview of Nifty 50 Support and Resistance
After Closing September 19, 2025, the Nifty 50 index is in a strong medium- to long-term uptrend, although it has shown some signs of consolidation and profit-booking in the recent sessions. The bullish sentiment remains largely intact. Though SEBI Registered market analysts are advising a "buy-on-dips" strategy But I am not 100% AGREE with them.
Key Resistance Levels
25,435 - 25,549: This is the most immediate and crucial resistance zone. The index has faced selling pressure around these levels, and a decisive break above this range is necessary to resume the upward momentum. A sustained move beyond this point is expected to trigger a fresh rally.
25,714.50[/b]: If the index successfully breaks past the 25,550 mark, this is the next significant resistance level and a potential short-term target.
25850 - 25928: If the index successfully breaks past the 25,714 mark, this is the next significant resistance level and a potential mid-term target.
26,029: This is near a major psychological (i.e 26000) resistance level. A strong and sustained move above 25,928 could pave the way for a rally toward this landmark.
26244: This is Last resistance level (near all time High i.e 26277) before Creating New All Time High. A strong and sustained move above 26,029 could pave the way for a rally toward this landmark.
Key Support Levels
25,255 to 25,235: This is the immediate and strong support zone. The index has found buying interest at these levels, and a hold above this range is a positive signal. This area is considered a key level to watch for potential buying opportunities (if Slips may touch 25214)on short-term pullbacks.
25,118 - 25041: This area, which around coincides with the 20-day Exponential Moving Average (EMA) and key Fibonacci retracement level, is a major support. A break below this level could indicate a more significant correction.
24,970 to 24,714: These are strong support zones that, in the event of a deeper correction, are likely to attract significant buying interest. Any decline towards these levels is widely seen as a valuable entry point for long-term investors. Though 24810 may resist the Fall.
# " Intraday &WEEKLY Levels" will be published later
Use any Momentum Indicator / Oscillatoror as you "USED to" to Take entry.
📢 Disclaimer
I am not a SEBI-registered financial adviser.
The information, views, and ideas shared here are purely for educational and informational purposes only. They are not intended as investment advice or a recommendation to buy, sell, or hold any financial instruments.
Trading and investing in the stock market involves risk, and you should do your own research and analysis. You are solely responsible for any decisions made based on this research.
"As HARD EARNED MONEY IS YOUR's, So DECISION SHOULD HAVE TO BE YOUR's".
Trade active
Technical Trends and AnalysisTrend: The overall trend for the Nifty 50 remains bullish. The index is trading above its key moving averages, including the 20, 50, and 200-day EMAs, which is a classic sign of a healthy uptrend.
Momentum: Momentum indicators, such as the Relative Strength Index (RSI), till now not entered in the overbought zone , which explains the recent consolidation. However, the RSI still has room for a further upside move before becoming extremely overbought, suggesting the rally is not yet exhausted.
Market Breadth: The market breadth has been improving, with a high percentage of Nifty stocks trading above their short- and medium-term moving averages. This indicates broad-based participation in the rally and reinforces the underlying strength of the market. Notice One Thingon Friday TRADED Value of BEST 10 - 20 Stocks in NIFTY 50 Significantly Increases Compare to first Four trading days of Last week.
Also GIFTNIFTY Closes Significantly Down in Last hour of trade.
Note
Do COMMENT for USEFULLNESS or LACKING.Trade closed: target reached
Identified 45 trading days back.Though an attempt misses just 30 points on 21st Trading days.
WATCH Chart Scren shot Carefully.
Related publications
Disclaimer
The information and publications are not meant to be, and do not constitute, financial, investment, trading, or other types of advice or recommendations supplied or endorsed by TradingView. Read more in the Terms of Use.
Related publications
Disclaimer
The information and publications are not meant to be, and do not constitute, financial, investment, trading, or other types of advice or recommendations supplied or endorsed by TradingView. Read more in the Terms of Use.