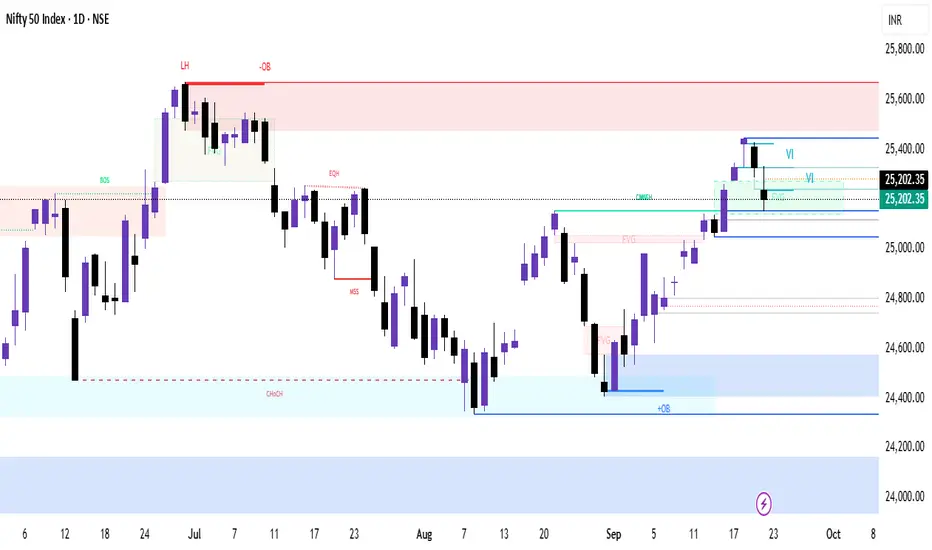
🕒 1-Day Chart
Support Levels:
25,200: Immediate support; bulls need to defend this level.
25,050: Critical support; a break below this could lead to further downside.
Resistance Levels:
25,300: Immediate resistance; a breakout above this could lead to a rally.
25,450–25,500: Key resistance zone; bulls need to reclaim this for a bullish trend.
Technical Indicators:
RSI is below 60, indicating weakening momentum.
MACD shows a bearish crossover, suggesting potential downside.
Market Sentiment:
The index formed a bearish candle with a long upper shadow, indicating selling pressure at higher levels.
The index is trading below the 10-day EMA, suggesting a short-term downtrend.
🕓 4-Hour Chart
Support Levels:
25,150: Immediate support; a break below this could lead to further downside.
25,000: Strong support; bulls need to defend this level.
Resistance Levels:
25,300: Immediate resistance; a breakout above this could lead to a rally.
25,450: Key resistance; bulls need to reclaim this for a bullish trend.
Technical Indicators:
RSI is below 60, indicating weakening momentum.
MACD shows a bearish crossover, suggesting potential downside.
Market Sentiment:
The index is trading below the 10-period EMA, suggesting a short-term downtrend.
🕐 1-Hour Chart
Support Levels:
25,150: Immediate support; a break below this could lead to further downside.
25,000: Strong support; bulls need to defend this level.
Resistance Levels:
25,250: Immediate resistance; a breakout above this could lead to a rally.
25,400: Key resistance; bulls need to reclaim this for a bullish trend.
Technical Indicators:
RSI is below 60, indicating weakening momentum.
MACD shows a bearish crossover, suggesting potential downside.
Market Sentiment:
The index is trading below the 10-period EMA, suggesting a short-term downtrend.
🕒 15-Minute Chart
Support Levels:
25,150: Immediate support; a break below this could lead to further downside.
25,000: Strong support; bulls need to defend this level.
Resistance Levels:
25,250: Immediate resistance; a breakout above this could lead to a rally.
25,400: Key resistance; bulls need to reclaim this for a bullish trend.
Technical Indicators:
RSI is below 60, indicating weakening momentum.
MACD shows a bearish crossover, suggesting potential downside.
Market Sentiment:
The index is trading below the 10-period EMA, suggesting a short-term downtrend.
Support Levels:
25,200: Immediate support; bulls need to defend this level.
25,050: Critical support; a break below this could lead to further downside.
Resistance Levels:
25,300: Immediate resistance; a breakout above this could lead to a rally.
25,450–25,500: Key resistance zone; bulls need to reclaim this for a bullish trend.
Technical Indicators:
RSI is below 60, indicating weakening momentum.
MACD shows a bearish crossover, suggesting potential downside.
Market Sentiment:
The index formed a bearish candle with a long upper shadow, indicating selling pressure at higher levels.
The index is trading below the 10-day EMA, suggesting a short-term downtrend.
🕓 4-Hour Chart
Support Levels:
25,150: Immediate support; a break below this could lead to further downside.
25,000: Strong support; bulls need to defend this level.
Resistance Levels:
25,300: Immediate resistance; a breakout above this could lead to a rally.
25,450: Key resistance; bulls need to reclaim this for a bullish trend.
Technical Indicators:
RSI is below 60, indicating weakening momentum.
MACD shows a bearish crossover, suggesting potential downside.
Market Sentiment:
The index is trading below the 10-period EMA, suggesting a short-term downtrend.
🕐 1-Hour Chart
Support Levels:
25,150: Immediate support; a break below this could lead to further downside.
25,000: Strong support; bulls need to defend this level.
Resistance Levels:
25,250: Immediate resistance; a breakout above this could lead to a rally.
25,400: Key resistance; bulls need to reclaim this for a bullish trend.
Technical Indicators:
RSI is below 60, indicating weakening momentum.
MACD shows a bearish crossover, suggesting potential downside.
Market Sentiment:
The index is trading below the 10-period EMA, suggesting a short-term downtrend.
🕒 15-Minute Chart
Support Levels:
25,150: Immediate support; a break below this could lead to further downside.
25,000: Strong support; bulls need to defend this level.
Resistance Levels:
25,250: Immediate resistance; a breakout above this could lead to a rally.
25,400: Key resistance; bulls need to reclaim this for a bullish trend.
Technical Indicators:
RSI is below 60, indicating weakening momentum.
MACD shows a bearish crossover, suggesting potential downside.
Market Sentiment:
The index is trading below the 10-period EMA, suggesting a short-term downtrend.
Related publications
Disclaimer
The information and publications are not meant to be, and do not constitute, financial, investment, trading, or other types of advice or recommendations supplied or endorsed by TradingView. Read more in the Terms of Use.
Related publications
Disclaimer
The information and publications are not meant to be, and do not constitute, financial, investment, trading, or other types of advice or recommendations supplied or endorsed by TradingView. Read more in the Terms of Use.