🔎 Market Structure Analysis
1. Higher Timeframe (4H)
Price has broken down below 25,000 with a Market Structure Shift (MSS).
A Fair Value Gap (FVG) exists between 24,900 – 25,000, acting as supply.
Strong rejection near 25,100–25,200 supply zone; price is now following a descending channel.
Current structure is bearish, with LTF supports being tested.
Key Levels (4H):
Resistance / Supply: 24,900 – 25,000 / 25,100 – 25,200
Immediate Support: 24,680 – 24,700
Major Support: 24,350 – 24,400
2. Medium Timeframe (1H)
Price is clearly respecting a downtrend channel.
The 1H chart shows Lower Highs & Lower Lows (BOS after MSS).
The FVG around 24,750 – 24,800 could act as a reaction zone if price retests.
If 24,680 breaks, next liquidity draw is 24,400.
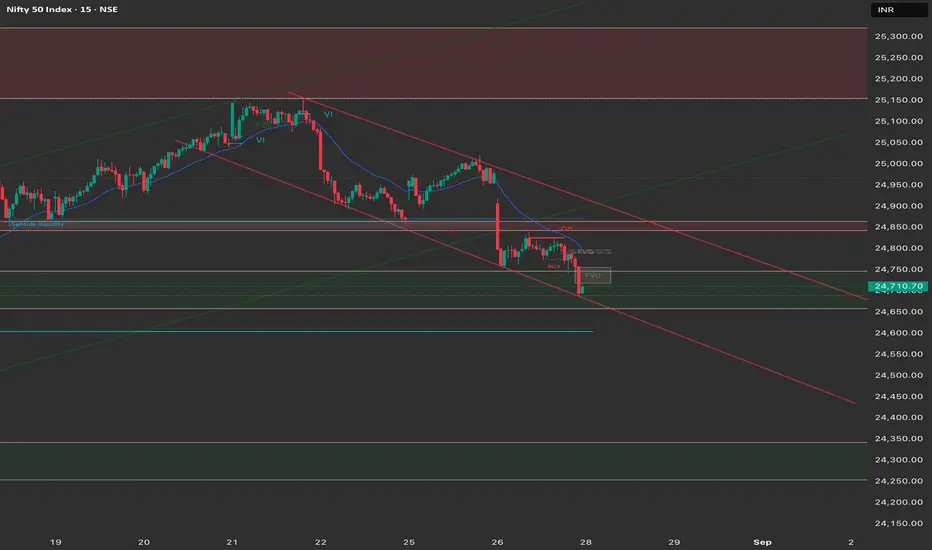
3. Lower Timeframe (15M)
BOS confirmed to the downside with rejection from 24,800 FVG.
Liquidity sweep around 24,700 and a quick rejection shows sellers still in control.
If buyers defend 24,680, a scalp pullback towards 24,800 is possible.
If not, momentum could push straight to 24,500–24,400.
🎯 Trading Plan for 28th August
🔻 Bearish Bias (Primary Plan)
Sell on Pullbacks
Entry: 24,770 – 24,800 (FVG / OB zone retest)
SL: Above 24,880
Targets:
TP1: 24,680
TP2: 24,550
TP3: 24,400
🔺 Bullish Scenario (Countertrend Scalps Only)
If price holds 24,680 with strong rejection, a bounce to 24,800 – 24,850 is possible.
Entry: 24,700 – 24,720
SL: Below 24,640
Targets: 24,800 – 24,850
⚖️ Bias & Risk Management
Bias: Bearish (sell the rallies).
Invalidation: If price closes above 24,900 (reclaims FVG), bearish bias is invalid.
Risk Control: Stick to 1:2 or higher RR setups, avoid trading both directions simultaneously.
1. Higher Timeframe (4H)
Price has broken down below 25,000 with a Market Structure Shift (MSS).
A Fair Value Gap (FVG) exists between 24,900 – 25,000, acting as supply.
Strong rejection near 25,100–25,200 supply zone; price is now following a descending channel.
Current structure is bearish, with LTF supports being tested.
Key Levels (4H):
Resistance / Supply: 24,900 – 25,000 / 25,100 – 25,200
Immediate Support: 24,680 – 24,700
Major Support: 24,350 – 24,400
2. Medium Timeframe (1H)
Price is clearly respecting a downtrend channel.
The 1H chart shows Lower Highs & Lower Lows (BOS after MSS).
The FVG around 24,750 – 24,800 could act as a reaction zone if price retests.
If 24,680 breaks, next liquidity draw is 24,400.
3. Lower Timeframe (15M)
BOS confirmed to the downside with rejection from 24,800 FVG.
Liquidity sweep around 24,700 and a quick rejection shows sellers still in control.
If buyers defend 24,680, a scalp pullback towards 24,800 is possible.
If not, momentum could push straight to 24,500–24,400.
🎯 Trading Plan for 28th August
🔻 Bearish Bias (Primary Plan)
Sell on Pullbacks
Entry: 24,770 – 24,800 (FVG / OB zone retest)
SL: Above 24,880
Targets:
TP1: 24,680
TP2: 24,550
TP3: 24,400
🔺 Bullish Scenario (Countertrend Scalps Only)
If price holds 24,680 with strong rejection, a bounce to 24,800 – 24,850 is possible.
Entry: 24,700 – 24,720
SL: Below 24,640
Targets: 24,800 – 24,850
⚖️ Bias & Risk Management
Bias: Bearish (sell the rallies).
Invalidation: If price closes above 24,900 (reclaims FVG), bearish bias is invalid.
Risk Control: Stick to 1:2 or higher RR setups, avoid trading both directions simultaneously.
Disclaimer
The information and publications are not meant to be, and do not constitute, financial, investment, trading, or other types of advice or recommendations supplied or endorsed by TradingView. Read more in the Terms of Use.
Disclaimer
The information and publications are not meant to be, and do not constitute, financial, investment, trading, or other types of advice or recommendations supplied or endorsed by TradingView. Read more in the Terms of Use.