Based on the charts and the market's performance on Monday, October 13, the Nifty is currently undergoing a minor pullback/consolidation after failing to break the overhead resistance, but the overall structure remains bullish.
Detailed Market Structure Breakdown
4-Hour Chart (Macro Trend)
Structure: The Nifty is firmly in a bullish recovery phase, trading within a clear ascending channel. The price faced rejection near the 25,300 - 25,400 supply zone (previous high) and has retreated. However, the last 4H candle shows buying interest at the immediate support level, forming a temporary consolidation.
Key Levels:
Major Supply (Resistance): 25,300 - 25,400. This area is the major hurdle. A breakout here is needed to challenge the September high of 25,448.
Major Demand (Support): 25,000 - 25,050. This area, which includes the lower boundary of the ascending channel and a prior FVG (Fair Value Gap), is the must-hold zone for the short-term uptrend.
Outlook: The trend is sideways-to-bullish. Dips are expected to be bought as long as the market holds the 25,000 psychological support.
1-Hour Chart (Intermediate View)
Structure: The 1H chart shows the market is consolidating after a strong initial upward move. The price has violated the steep, inner ascending trendline but is holding the horizontal demand zone. The structure appears corrective in the very short term (since the high on Friday).
Key Levels:
Immediate Resistance: 25,300 (The recent swing high).
Immediate Support: 25,150 (The area where the price consolidated on Monday, and a current Order Block/Demand Zone).
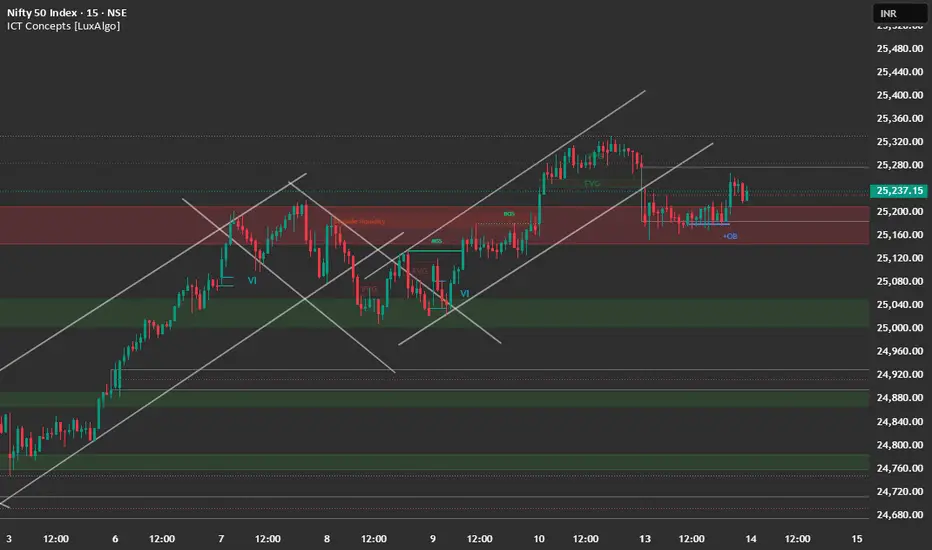
15-Minute Chart (Intraday View)
Structure: The 15M chart shows the index trading in a tight range since Friday's close, forming a small consolidation pattern right above 25,150. The close was slightly positive, suggesting limited bearish follow-through.
Key Levels:
Intraday Supply: 25,280.
Intraday Demand: 25,150.
Outlook: Neutral, awaiting a breakout from the Monday's range.
📈 Trade Plan (Tuesday, 14th October)
Market Outlook: Nifty is consolidating near its highs, suggesting a pause before the next directional move. The strategy is to buy the bounce from a key support or short the failure at resistance.
Bullish Scenario (Primary Plan)
Justification: The overall bullish structure remains intact, supported by the 25,150 demand zone.
Entry: Long entry on a decisive break and 15-minute candle close above 25,280. Alternatively, look for a dip entry near 25,150 (the immediate consolidation support).
Stop Loss (SL): Place a stop loss below 25,050 (below the ascending channel and FVG support).
Targets:
T1: 25,400 (Major supply zone).
T2: 25,500 (Next major psychological target).
Bearish Scenario (Counter-Trend/Correction Plan)
Justification: A failure to sustain the consolidation could lead to a healthy correction toward the primary ascending channel support.
Trigger: A decisive break and 15-minute candle close below 25,150.
Entry: Short entry below 25,150.
Stop Loss (SL): Above 25,280.
Targets:
T1: 25,050 (Lower channel trendline/FVG support).
T2: 24,900 (Major swing low/support base).
Key Levels for Observation:
Immediate Decision Point: The 25,150 - 25,280 consolidation zone.
Bullish Confirmation: A break and sustained move above 25,280.
Bearish Warning: A move below 25,050 suggests the short-term uptrend is broken.
Line in the Sand: 25,000. Below this level, the short-term bullish bias is nullified.
Detailed Market Structure Breakdown
4-Hour Chart (Macro Trend)
Structure: The Nifty is firmly in a bullish recovery phase, trading within a clear ascending channel. The price faced rejection near the 25,300 - 25,400 supply zone (previous high) and has retreated. However, the last 4H candle shows buying interest at the immediate support level, forming a temporary consolidation.
Key Levels:
Major Supply (Resistance): 25,300 - 25,400. This area is the major hurdle. A breakout here is needed to challenge the September high of 25,448.
Major Demand (Support): 25,000 - 25,050. This area, which includes the lower boundary of the ascending channel and a prior FVG (Fair Value Gap), is the must-hold zone for the short-term uptrend.
Outlook: The trend is sideways-to-bullish. Dips are expected to be bought as long as the market holds the 25,000 psychological support.
1-Hour Chart (Intermediate View)
Structure: The 1H chart shows the market is consolidating after a strong initial upward move. The price has violated the steep, inner ascending trendline but is holding the horizontal demand zone. The structure appears corrective in the very short term (since the high on Friday).
Key Levels:
Immediate Resistance: 25,300 (The recent swing high).
Immediate Support: 25,150 (The area where the price consolidated on Monday, and a current Order Block/Demand Zone).
15-Minute Chart (Intraday View)
Structure: The 15M chart shows the index trading in a tight range since Friday's close, forming a small consolidation pattern right above 25,150. The close was slightly positive, suggesting limited bearish follow-through.
Key Levels:
Intraday Supply: 25,280.
Intraday Demand: 25,150.
Outlook: Neutral, awaiting a breakout from the Monday's range.
📈 Trade Plan (Tuesday, 14th October)
Market Outlook: Nifty is consolidating near its highs, suggesting a pause before the next directional move. The strategy is to buy the bounce from a key support or short the failure at resistance.
Bullish Scenario (Primary Plan)
Justification: The overall bullish structure remains intact, supported by the 25,150 demand zone.
Entry: Long entry on a decisive break and 15-minute candle close above 25,280. Alternatively, look for a dip entry near 25,150 (the immediate consolidation support).
Stop Loss (SL): Place a stop loss below 25,050 (below the ascending channel and FVG support).
Targets:
T1: 25,400 (Major supply zone).
T2: 25,500 (Next major psychological target).
Bearish Scenario (Counter-Trend/Correction Plan)
Justification: A failure to sustain the consolidation could lead to a healthy correction toward the primary ascending channel support.
Trigger: A decisive break and 15-minute candle close below 25,150.
Entry: Short entry below 25,150.
Stop Loss (SL): Above 25,280.
Targets:
T1: 25,050 (Lower channel trendline/FVG support).
T2: 24,900 (Major swing low/support base).
Key Levels for Observation:
Immediate Decision Point: The 25,150 - 25,280 consolidation zone.
Bullish Confirmation: A break and sustained move above 25,280.
Bearish Warning: A move below 25,050 suggests the short-term uptrend is broken.
Line in the Sand: 25,000. Below this level, the short-term bullish bias is nullified.
Disclaimer
The information and publications are not meant to be, and do not constitute, financial, investment, trading, or other types of advice or recommendations supplied or endorsed by TradingView. Read more in the Terms of Use.
Disclaimer
The information and publications are not meant to be, and do not constitute, financial, investment, trading, or other types of advice or recommendations supplied or endorsed by TradingView. Read more in the Terms of Use.