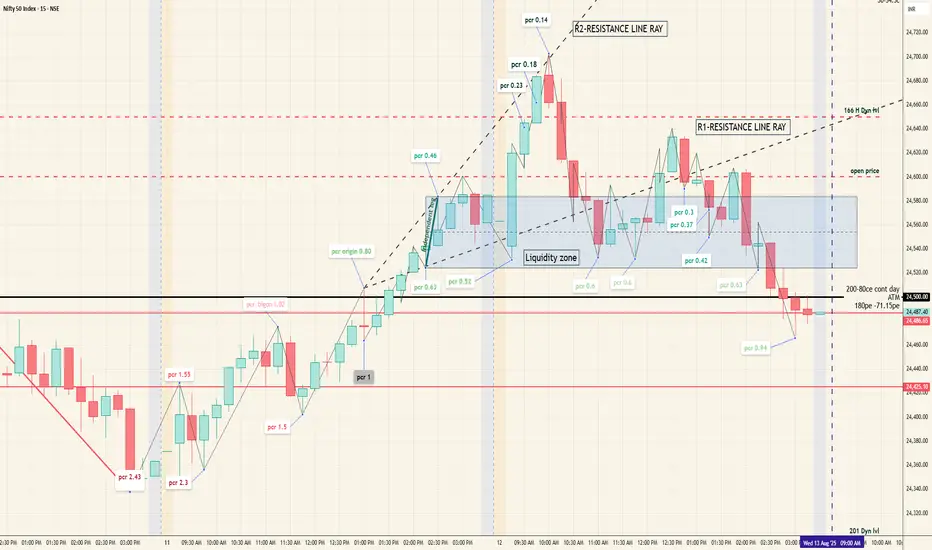
24500 considered to be a major level as the market crossed more than once, and showed some significant value changes, which is pcr values after crossing. So my idea was if market opens above this 24500 strong level it will be a strong opening. And next market showed the continuity of its opening by making an independent swing which I have marked green. So as technical drawings.
1. I drew a a cone from previous day attempt swing high to this swing leg connecting both High and low. My idea is if market wants to plunge aggressively with speed then it should sustain at this line called S2 now ResistanceR2. Next it should plunge rom this line to make another move to show its speed movement. This is pure chart analytics till here.
2. Since I have considered 24500 a strong level Even pcr value of all these high swings crossing it should go below 0.01-0.009 or below10%.
3. Same time the below derivatives value should show the support and above it should release. at this time or else if the conditions ceases . ...
Condition -failure seen
1. The market will first follow through the speed loss by low swings to below cone S1- now written as ResistanceR1..
Then, At lower lows swings the pcr value reflected above 0 .25- then to 0.5.
2. But showed the break of strong level making pcr above 0.5 in swing lows. This showed its loosing bullish strength.
INFERENCE:
1.From yesterdays the market showed its bullish nature by
a. strong closing and today by strong opening.
b. buy its high speed swings at higher cone level.
Why failed:
a Swing didn't plunge from speed cone level.
b. Speed of wing became slow ,it should have reached by 2:35-to -2:40pm-
C. Speed loss shown, pcr was not low as 0.01- 0.25 as expected.
d. Support and release of macro levels didn't follow through.
Thank you for your time and reading.
Disclaimer
The information and publications are not meant to be, and do not constitute, financial, investment, trading, or other types of advice or recommendations supplied or endorsed by TradingView. Read more in the Terms of Use.
Disclaimer
The information and publications are not meant to be, and do not constitute, financial, investment, trading, or other types of advice or recommendations supplied or endorsed by TradingView. Read more in the Terms of Use.