📊 NIFTY 50 Weekly Analysis – Elliott Wave & Retracement Outlook (April Week 2)
As per the latest Elliott Wave analysis and Fibonacci retracement zones plotted on the chart, NIFTY is currently at a critical juncture. Price action from here will define whether the market resumes upward correction or heads for a deeper fall.
🧠 Technical Structure Overview
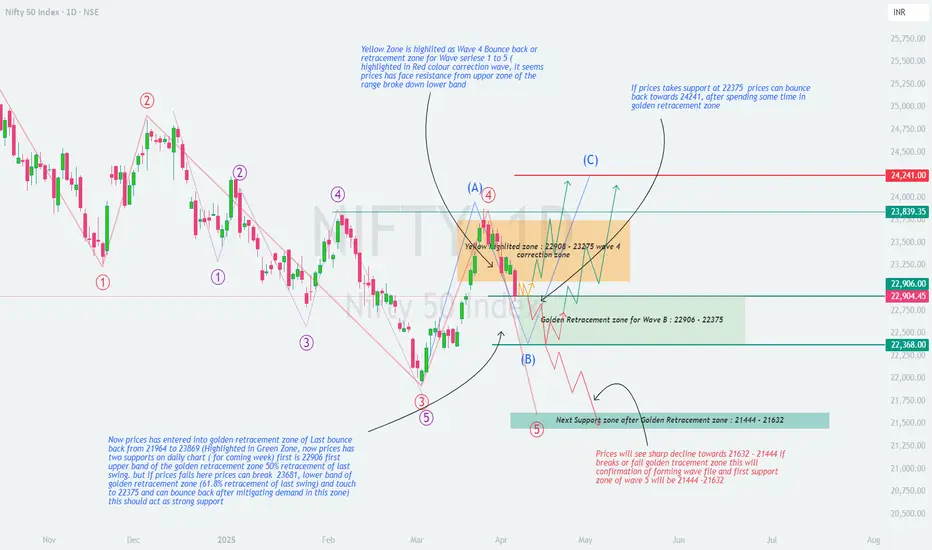
The red-labelled impulse wave series 1 to 5 has completed, indicating a completed correction wave structure.
A corrective bounce has been observed post-Wave 5 in the form of Wave A.
Price is now moving in a Wave B correction and has entered a key Fibonacci retracement zone.
📍 Important Zones to Watch
🔶 Yellow Zone – Wave 4 Correction Resistance:
Range: 22,908 – 23,275
This was a previous bounce zone (Wave 4), now acting as a resistance range.
Price faced strong rejection here and reversed down into retracement territory.
🟩 Golden Fibonacci Retracement Zone for Wave B:
Range: 22,906 – 22,368
Price has entered this critical retracement zone.
This range corresponds to:
50% retracement = 22,906 (upper band)
61.8% retracement = 22,368 (lower band)
Implication: If NIFTY sustains within this zone and forms a base, it may initiate a move towards Wave C.
🧭 Scenarios for Coming Week
✅ Bullish Scenario:
If price sustains above 22,368 and reclaims 22,906, it can bounce back towards:
🎯 Target 1: 23,839
🎯 Target 2: 24,241 (Wave C projection)
Confluence: Wave A-B-C projection fits well within this move.
❌ Bearish Scenario:
If price breaks below 22,368 and fails to hold the golden zone:
Expect a sharp decline towards support zone: 21,444 – 21,632
This move would confirm the formation of another impulsive Wave 5 down.
🔍 Key Support and Resistance Levels
Resistance:
22,908
23,275
23,839
24,241
Support:
22,906 (Upper Golden Zone)
22,368 (Lower Golden Zone)
21,632 – 21,444 (Major Support Zone)
📌 Conclusion:
NIFTY is in a decisive zone. Whether we go for Wave C up or another Wave 5 down depends on price action within the 22,906 – 22,368 zone.
Traders should:
Watch for confirmation candles and volumes.
Use demand zone reactions to position accordingly.
Maintain strict risk management.
💬 Share your views in the comments – do you expect a bounce from here or a breakdown?
#NIFTY50 #ElliottWave #TechnicalAnalysis #TradingView #NIFTYAnalysis #Fibonacci #SwingTrading #PriceAction
As per the latest Elliott Wave analysis and Fibonacci retracement zones plotted on the chart, NIFTY is currently at a critical juncture. Price action from here will define whether the market resumes upward correction or heads for a deeper fall.
🧠 Technical Structure Overview
The red-labelled impulse wave series 1 to 5 has completed, indicating a completed correction wave structure.
A corrective bounce has been observed post-Wave 5 in the form of Wave A.
Price is now moving in a Wave B correction and has entered a key Fibonacci retracement zone.
📍 Important Zones to Watch
🔶 Yellow Zone – Wave 4 Correction Resistance:
Range: 22,908 – 23,275
This was a previous bounce zone (Wave 4), now acting as a resistance range.
Price faced strong rejection here and reversed down into retracement territory.
🟩 Golden Fibonacci Retracement Zone for Wave B:
Range: 22,906 – 22,368
Price has entered this critical retracement zone.
This range corresponds to:
50% retracement = 22,906 (upper band)
61.8% retracement = 22,368 (lower band)
Implication: If NIFTY sustains within this zone and forms a base, it may initiate a move towards Wave C.
🧭 Scenarios for Coming Week
✅ Bullish Scenario:
If price sustains above 22,368 and reclaims 22,906, it can bounce back towards:
🎯 Target 1: 23,839
🎯 Target 2: 24,241 (Wave C projection)
Confluence: Wave A-B-C projection fits well within this move.
❌ Bearish Scenario:
If price breaks below 22,368 and fails to hold the golden zone:
Expect a sharp decline towards support zone: 21,444 – 21,632
This move would confirm the formation of another impulsive Wave 5 down.
🔍 Key Support and Resistance Levels
Resistance:
22,908
23,275
23,839
24,241
Support:
22,906 (Upper Golden Zone)
22,368 (Lower Golden Zone)
21,632 – 21,444 (Major Support Zone)
📌 Conclusion:
NIFTY is in a decisive zone. Whether we go for Wave C up or another Wave 5 down depends on price action within the 22,906 – 22,368 zone.
Traders should:
Watch for confirmation candles and volumes.
Use demand zone reactions to position accordingly.
Maintain strict risk management.
💬 Share your views in the comments – do you expect a bounce from here or a breakdown?
#NIFTY50 #ElliottWave #TechnicalAnalysis #TradingView #NIFTYAnalysis #Fibonacci #SwingTrading #PriceAction
Trade closed: target reached
Disclaimer
The information and publications are not meant to be, and do not constitute, financial, investment, trading, or other types of advice or recommendations supplied or endorsed by TradingView. Read more in the Terms of Use.
Disclaimer
The information and publications are not meant to be, and do not constitute, financial, investment, trading, or other types of advice or recommendations supplied or endorsed by TradingView. Read more in the Terms of Use.