## Current NIFTY 50 Price
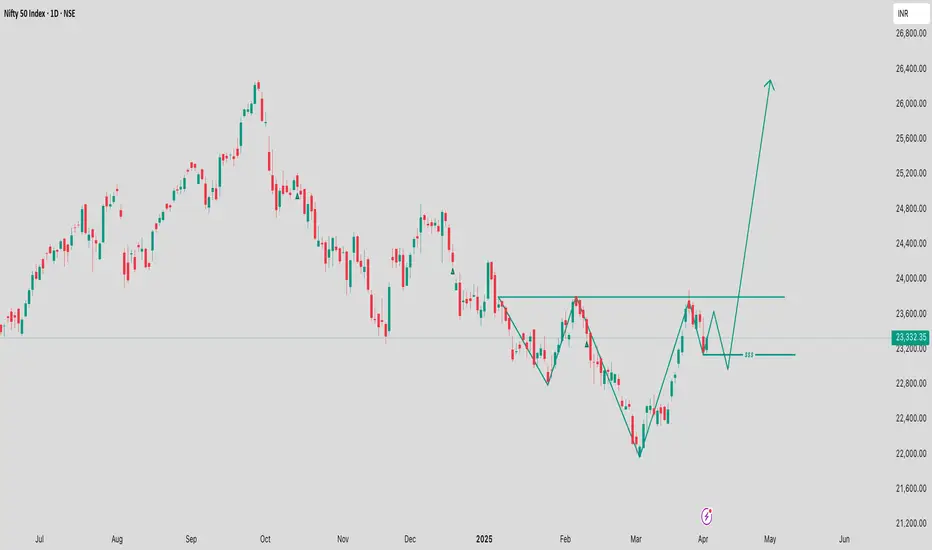
As of the latest data, the NIFTY 50 is trading at **23,332.35**, reflecting a gain of **+166.65 (0.72%)**.
**Short-Term Technical Outlook**
- **Resistance levels**: Immediate resistance is observed at **23,566**, with potential upside targets at **23,640**, **23,715**, and **23,810** if sustained. A decisive close above **23,800** could propel the index toward **24,500**
- **Support zones**: Key support lies in the **23,300–23,200** range, with a breakdown below **23,413** signaling short-term bearish momentum
- **Volatility**: Recent sessions saw a sharp decline to **23,486**, breaking an ascending channel pattern on lower timeframes
**Long-Term Technical Outlook**
- **Bullish scenario**: Sustaining above **23,850** may trigger a rally toward **24,000**, **24,210**, and **24,500**, with a stop-loss at **23,700**
- **Bearish risk**: A breakdown below **22,300** could indicate further downside
**Technical Indicators**
- **RSI (14)**: Neutral at **47.54**, suggesting balanced momentum
- **MACD**: Signals a buy with a value of **17.59**
- **Moving Averages**: Mixed signals, with short-term SMAs (5, 10, 20) indicating sell pressure, while longer-term SMAs (50, 100, 200) remain bullish
- **Stochastic indicators**: Overbought conditions in STOCH (99.214) contrast with oversold STOCHRSI (23.768)
**Fundamental and Sentiment Factors**
- **FII/DII activity**: Foreign Institutional Investors (FIIs) bought **₹2,240 crore** recently, while Domestic Institutional Investors (DIIs) sold **₹696 crore**. Monthly trends show FII outflows (**₹4,744 crore**) offset by strong DII inflows (**₹27,421 crore**)
- **External drivers**: A weakening U.S. dollar (DXY at **104.3**) and declining U.S. Treasury yields support rupee appreciation, potentially aiding market gains
**Valuation Metrics**
- **P/E ratio**: **21.2**
- **Dividend yield**: **1.33%**
- **Market cap**: **₹1,86,04,127 crore**
**Strategic Recommendation**
Investors may consider a **buy-on-dips strategy** for long-term positions, leveraging current valuations. Short-term traders should monitor **23,566** (upside trigger) and **23,413** (downside threshold) for directional cues
Disclaimer
The information and publications are not meant to be, and do not constitute, financial, investment, trading, or other types of advice or recommendations supplied or endorsed by TradingView. Read more in the Terms of Use.
Disclaimer
The information and publications are not meant to be, and do not constitute, financial, investment, trading, or other types of advice or recommendations supplied or endorsed by TradingView. Read more in the Terms of Use.