Market Context: The Nifty snapped its eight-day losing streak on Wednesday (October 1st), following the RBI MPC decision to hold the repo rate. This confirms a strong reversal from the critical 24,600 support zone.
Detailed Market Structure Breakdown
4-Hour Chart (Macro Trend)
Structure: The Nifty has decisively broken out of the steep descending corrective channel. The strong bullish candle on Wednesday (October 1st) has closed well above the channel's upper trendline, signaling a high-probability short-term reversal. The market has now recovered more than 50% of the last major leg down.
Key Levels:
Major Supply (Resistance): 25,050 - 25,150. This area is the next significant hurdle, aligning with the prior consolidation zone.
Major Demand (Support): 24,600 - 24,700. This is the key reversal zone. As long as the Nifty trades above 24,700, the bullish bounce is in control.
Outlook: The short-term bias has shifted from bearish to cautiously bullish. The trend will be "Buy on Dips" until the index retests the 25,150 zone.
1-Hour Chart (Intermediate View)
Structure: The 1H chart shows a clear Break of Structure (BOS) on the upside, as the price broke the descending channel and closed strongly. The market is now back in a short-term upward trajectory.
Key Levels:
Immediate Resistance: 24,880. This is the high of the current bounce and a minor psychological resistance.
Immediate Support: 24,750 (The top of the recent consolidation and FVG support).
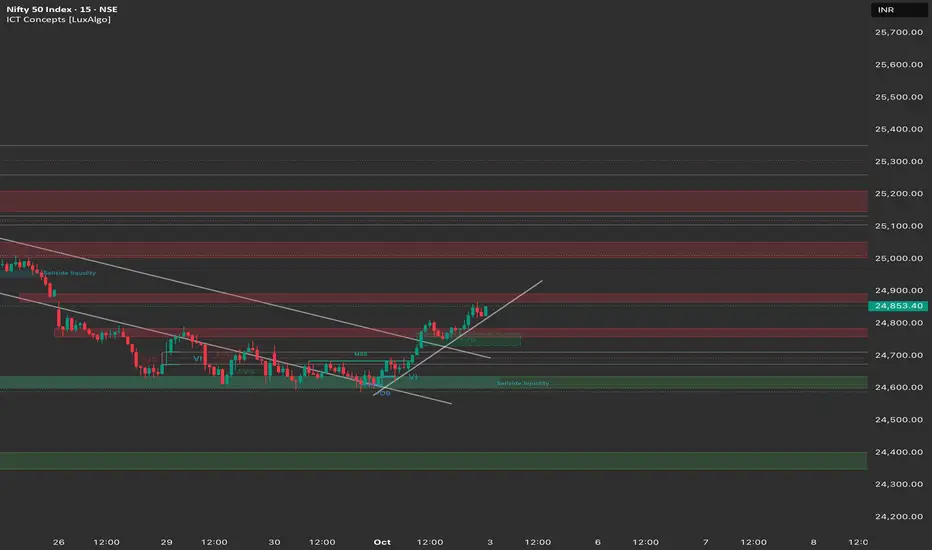
15-Minute Chart (Intraday View)
Structure: The 15M chart shows strong bullish momentum. The index successfully took out Sell-side Liquidity below 24,600 and then reversed sharply. It closed strongly above the EMA and is forming a continuation pattern (flag) right below 24,900.
Key Levels:
Intraday Supply: 24,900.
Intraday Demand: 24,800.
Outlook: Strongly Bullish for the session open.
📈 Trade Plan (Friday, 3rd October)
Market Outlook: The Nifty is in a strong bounce phase after the RBI policy catalyst. The primary strategy will be to buy on dips or buy on continuation.
Bullish Scenario (Primary Plan)
Justification: The strong close and confirmed reversal pattern across timeframes favor continuation towards the next major supply zone.
Entry: Long entry on a decisive break and 15-minute candle close above 24,900. Alternatively, look for a dip entry near 24,750 if the market retraces.
Stop Loss (SL): Place a stop loss below 24,700 (below the immediate FVG support).
Targets:
T1: 25,050 (Psychological level).
T2: 25,150 (Major supply zone).
T3: 25,250 (Upper resistance).
Bearish Scenario (Counter-Trend Plan)
Justification: This high-risk, counter-trend plan only becomes valid if the bounce is completely rejected.
Trigger: A decisive break and 1-hour candle close below 24,700.
Entry: Short entry below 24,700.
Stop Loss (SL): Above 24,850 (above the recent swing high).
Targets:
T1: 24,600 (Key reversal support).
T2: 24,400 (Deeper demand zone).
[b]Key Levels for Observation:
Immediate Decision Point: 24,800 - 24,900 zone.
Bullish Confirmation: A break and sustained move above 24,900.
Bearish Warning: A move below 24,700 suggests a reversal failure and consolidation.
Line in the Sand: 24,600. A break below this level nullifies the reversal bounce.
Detailed Market Structure Breakdown
4-Hour Chart (Macro Trend)
Structure: The Nifty has decisively broken out of the steep descending corrective channel. The strong bullish candle on Wednesday (October 1st) has closed well above the channel's upper trendline, signaling a high-probability short-term reversal. The market has now recovered more than 50% of the last major leg down.
Key Levels:
Major Supply (Resistance): 25,050 - 25,150. This area is the next significant hurdle, aligning with the prior consolidation zone.
Major Demand (Support): 24,600 - 24,700. This is the key reversal zone. As long as the Nifty trades above 24,700, the bullish bounce is in control.
Outlook: The short-term bias has shifted from bearish to cautiously bullish. The trend will be "Buy on Dips" until the index retests the 25,150 zone.
1-Hour Chart (Intermediate View)
Structure: The 1H chart shows a clear Break of Structure (BOS) on the upside, as the price broke the descending channel and closed strongly. The market is now back in a short-term upward trajectory.
Key Levels:
Immediate Resistance: 24,880. This is the high of the current bounce and a minor psychological resistance.
Immediate Support: 24,750 (The top of the recent consolidation and FVG support).
15-Minute Chart (Intraday View)
Structure: The 15M chart shows strong bullish momentum. The index successfully took out Sell-side Liquidity below 24,600 and then reversed sharply. It closed strongly above the EMA and is forming a continuation pattern (flag) right below 24,900.
Key Levels:
Intraday Supply: 24,900.
Intraday Demand: 24,800.
Outlook: Strongly Bullish for the session open.
📈 Trade Plan (Friday, 3rd October)
Market Outlook: The Nifty is in a strong bounce phase after the RBI policy catalyst. The primary strategy will be to buy on dips or buy on continuation.
Bullish Scenario (Primary Plan)
Justification: The strong close and confirmed reversal pattern across timeframes favor continuation towards the next major supply zone.
Entry: Long entry on a decisive break and 15-minute candle close above 24,900. Alternatively, look for a dip entry near 24,750 if the market retraces.
Stop Loss (SL): Place a stop loss below 24,700 (below the immediate FVG support).
Targets:
T1: 25,050 (Psychological level).
T2: 25,150 (Major supply zone).
T3: 25,250 (Upper resistance).
Bearish Scenario (Counter-Trend Plan)
Justification: This high-risk, counter-trend plan only becomes valid if the bounce is completely rejected.
Trigger: A decisive break and 1-hour candle close below 24,700.
Entry: Short entry below 24,700.
Stop Loss (SL): Above 24,850 (above the recent swing high).
Targets:
T1: 24,600 (Key reversal support).
T2: 24,400 (Deeper demand zone).
[b]Key Levels for Observation:
Immediate Decision Point: 24,800 - 24,900 zone.
Bullish Confirmation: A break and sustained move above 24,900.
Bearish Warning: A move below 24,700 suggests a reversal failure and consolidation.
Line in the Sand: 24,600. A break below this level nullifies the reversal bounce.
Disclaimer
The information and publications are not meant to be, and do not constitute, financial, investment, trading, or other types of advice or recommendations supplied or endorsed by TradingView. Read more in the Terms of Use.
Disclaimer
The information and publications are not meant to be, and do not constitute, financial, investment, trading, or other types of advice or recommendations supplied or endorsed by TradingView. Read more in the Terms of Use.