🔵 Nifty 50 Analysis
Timeframes Used: 4H, 1H, 15min
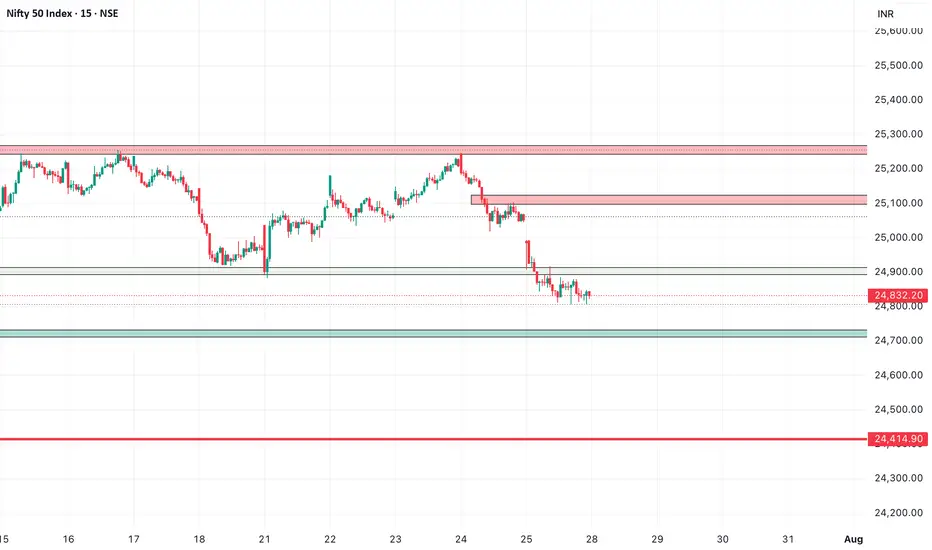
Current Price: ~24,832
🧠 Market Structure Overview:
4H Timeframe:
Market structure has shifted bearish with a series of lower highs and lower lows.
Price broke down below the minor demand zone (24,880–24,920), confirming short-term weakness.
A deeper demand zone around 24,680–24,720 is now in focus.
1H Timeframe:
Retest and rejection seen at previous demand (now flipped as resistance).
Consistent selling pressure from 25,100 and 25,230 zones.
Small base forming around 24,820, but momentum is weak.
🗺️ Key Zones:
Immediate Resistance (Supply):
24,880–24,920 (flipped supply)
25,100–25,130
25,220–25,270
Immediate Support (Demand):
24,680–24,720
24,410 (HTF support level from June base)
📈 Trade Plan:
🔻 Scenario 1 – Sell on Pullback
If price retests and rejects from 24,880–24,920 zone:
Entry: ~24,900 (on 15min confirmation like bearish engulfing or M-structure)
Stop Loss: Above 24,950
Targets: 24,720 → 24,680
🔺 Scenario 2 – Buy from Lower Demand
If price reacts strongly at 24,680–24,720 demand zone:
Entry: ~24,700 (confirmation on 15min bullish setup or strong wick rejection)
Stop Loss: Below 24,650
Targets: 24,880 → 25,000
🚫 No Trade Zone:
24,800–24,840
Price currently consolidating in this indecisive region
Wait for clear breakout or rejection confirmation from zones mentioned above
✅ Bias:
Preferred Bias: Sell on pullback until price reclaims 24,950 convincingly
Reversal Watch: Bullish only if strong reaction emerges from 24,680–24,720
Timeframes Used: 4H, 1H, 15min
Current Price: ~24,832
🧠 Market Structure Overview:
4H Timeframe:
Market structure has shifted bearish with a series of lower highs and lower lows.
Price broke down below the minor demand zone (24,880–24,920), confirming short-term weakness.
A deeper demand zone around 24,680–24,720 is now in focus.
1H Timeframe:
Retest and rejection seen at previous demand (now flipped as resistance).
Consistent selling pressure from 25,100 and 25,230 zones.
Small base forming around 24,820, but momentum is weak.
🗺️ Key Zones:
Immediate Resistance (Supply):
24,880–24,920 (flipped supply)
25,100–25,130
25,220–25,270
Immediate Support (Demand):
24,680–24,720
24,410 (HTF support level from June base)
📈 Trade Plan:
🔻 Scenario 1 – Sell on Pullback
If price retests and rejects from 24,880–24,920 zone:
Entry: ~24,900 (on 15min confirmation like bearish engulfing or M-structure)
Stop Loss: Above 24,950
Targets: 24,720 → 24,680
🔺 Scenario 2 – Buy from Lower Demand
If price reacts strongly at 24,680–24,720 demand zone:
Entry: ~24,700 (confirmation on 15min bullish setup or strong wick rejection)
Stop Loss: Below 24,650
Targets: 24,880 → 25,000
🚫 No Trade Zone:
24,800–24,840
Price currently consolidating in this indecisive region
Wait for clear breakout or rejection confirmation from zones mentioned above
✅ Bias:
Preferred Bias: Sell on pullback until price reclaims 24,950 convincingly
Reversal Watch: Bullish only if strong reaction emerges from 24,680–24,720
Disclaimer
The information and publications are not meant to be, and do not constitute, financial, investment, trading, or other types of advice or recommendations supplied or endorsed by TradingView. Read more in the Terms of Use.
Disclaimer
The information and publications are not meant to be, and do not constitute, financial, investment, trading, or other types of advice or recommendations supplied or endorsed by TradingView. Read more in the Terms of Use.