Nifty 50 - Key Support and Resistance Levels
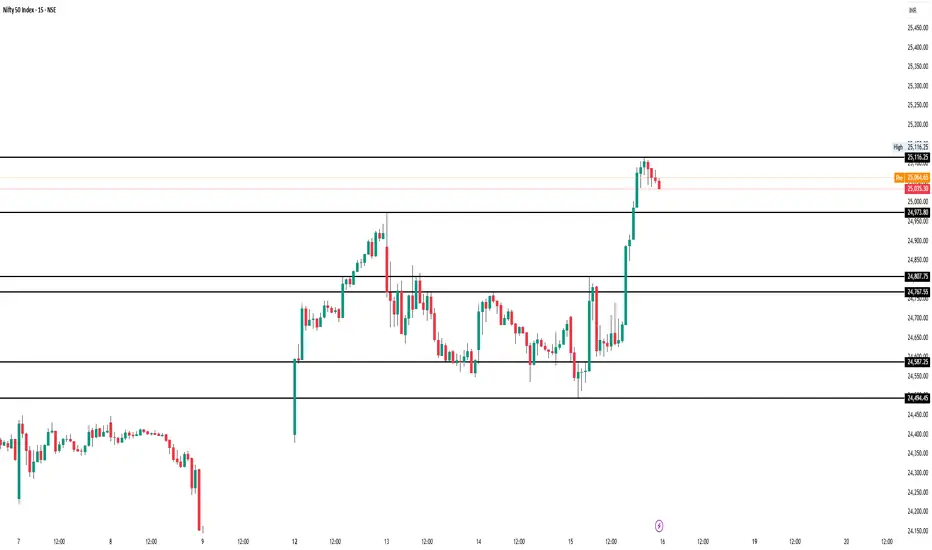
This 15-minute chart for the Nifty 50 index highlights the recent price action with key support and resistance zones clearly marked. After a sharp upward breakout, the index is currently trading around 25,035, facing immediate resistance at 25,116.25. Key support levels to watch include 24,973.80, 24,807.75, 24,767.55, 24,587.25, and 24,494.45, which might act as potential pullback zones in case of a correction.
Keep an eye on volume and price action around these levels for confirmation before taking trades.
Disclaimer
The information and publications are not meant to be, and do not constitute, financial, investment, trading, or other types of advice or recommendations supplied or endorsed by TradingView. Read more in the Terms of Use.
Disclaimer
The information and publications are not meant to be, and do not constitute, financial, investment, trading, or other types of advice or recommendations supplied or endorsed by TradingView. Read more in the Terms of Use.