🔹 4H Chart (Swing Bias)
Clear bearish market structure: Multiple consecutive red candles post 25,000 rejection.
Fair Value Gap (FVG) left around 24,700–24,800 → potential sell-on-rally zone.
Price broke structure and is respecting the descending channel.
Current price near 24,500 support, but next major demand is around 24,300–24,250.
EMA slope is pointing down → confirms bearish control.
✅ Bias: Bearish | Swing resistance at 24,750–24,800 | Demand near 24,300
🔹 1H Chart (Intraday Bias)
Market has printed multiple Break of Structures (BOS) confirming lower highs and lower lows.
Short-term FVG between 24,650–24,700 (ideal short re-entry area).
Current candles hovering around 24,500 handle with weak reaction → suggests liquidity is being built before another drop.
EMA acting as dynamic resistance, aligning with supply zones.
✅ Bias: Bearish | Resistance at 24,650–24,700 | Weak support at 24,480
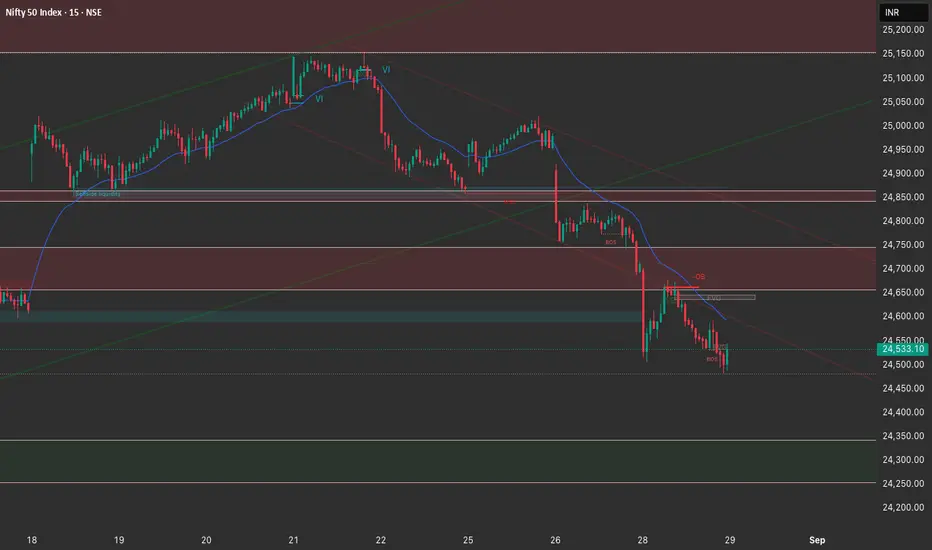
🔹 15M Chart (Execution Window)
Price rejected from micro order block around 24,600.
BOS printed downside again towards 24,500, confirming intraday weakness.
Liquidity resting below 24,480 → 24,450; sweep likely.
Next liquidity pool lies at 24,300 zone.
Very short-term relief bounces may occur, but they’re inside a bearish intraday trend channel.
✅ Bias: Bearish | Short-term rallies capped at 24,600 | Liquidity target 24,450 → 24,300
📝 Trade Plan for 29th August
🔴 Primary Bias: Short the rallies (high probability)
Entry Zone: 24,650–24,700 (into FVG + supply)
Stop Loss: Above 24,800
Targets:
T1 → 24,500
T2 → 24,350
T3 → 24,300
🟢 Countertrend Play: Long from demand sweep (only if strong reversal candles form)
Entry Zone: 24,300–24,350 (demand rejection)
Stop Loss: Below 24,200
Targets:
T1 → 24,500
T2 → 24,650
✅ Summary:
Main plan: Sell on rallies towards 24,650–24,700.
Alternate plan: Only long if 24,300 demand holds with a bullish reaction.
Overall: Trend & liquidity favors downside.
Clear bearish market structure: Multiple consecutive red candles post 25,000 rejection.
Fair Value Gap (FVG) left around 24,700–24,800 → potential sell-on-rally zone.
Price broke structure and is respecting the descending channel.
Current price near 24,500 support, but next major demand is around 24,300–24,250.
EMA slope is pointing down → confirms bearish control.
✅ Bias: Bearish | Swing resistance at 24,750–24,800 | Demand near 24,300
🔹 1H Chart (Intraday Bias)
Market has printed multiple Break of Structures (BOS) confirming lower highs and lower lows.
Short-term FVG between 24,650–24,700 (ideal short re-entry area).
Current candles hovering around 24,500 handle with weak reaction → suggests liquidity is being built before another drop.
EMA acting as dynamic resistance, aligning with supply zones.
✅ Bias: Bearish | Resistance at 24,650–24,700 | Weak support at 24,480
🔹 15M Chart (Execution Window)
Price rejected from micro order block around 24,600.
BOS printed downside again towards 24,500, confirming intraday weakness.
Liquidity resting below 24,480 → 24,450; sweep likely.
Next liquidity pool lies at 24,300 zone.
Very short-term relief bounces may occur, but they’re inside a bearish intraday trend channel.
✅ Bias: Bearish | Short-term rallies capped at 24,600 | Liquidity target 24,450 → 24,300
📝 Trade Plan for 29th August
🔴 Primary Bias: Short the rallies (high probability)
Entry Zone: 24,650–24,700 (into FVG + supply)
Stop Loss: Above 24,800
Targets:
T1 → 24,500
T2 → 24,350
T3 → 24,300
🟢 Countertrend Play: Long from demand sweep (only if strong reversal candles form)
Entry Zone: 24,300–24,350 (demand rejection)
Stop Loss: Below 24,200
Targets:
T1 → 24,500
T2 → 24,650
✅ Summary:
Main plan: Sell on rallies towards 24,650–24,700.
Alternate plan: Only long if 24,300 demand holds with a bullish reaction.
Overall: Trend & liquidity favors downside.
Disclaimer
The information and publications are not meant to be, and do not constitute, financial, investment, trading, or other types of advice or recommendations supplied or endorsed by TradingView. Read more in the Terms of Use.
Disclaimer
The information and publications are not meant to be, and do not constitute, financial, investment, trading, or other types of advice or recommendations supplied or endorsed by TradingView. Read more in the Terms of Use.