🔎 Nifty Market Structure Analysis
4H Chart
Trend Bias: Bearish → price is still making lower highs and lower lows.
Supply Zones:
24,880 – 24,940 (fresh supply, last bearish OB).
25,220 – 25,280 (major supply; high confluence).
Demand Zone:
24,520 – 24,560 (strong demand; multiple rejections).
Liquidity: Sell-side liquidity resting below 24,520, which may attract a sweep.
1H Chart
Price is consolidating between 24,520 (demand) and 24,880 (supply).
Recent bounce shows buyers defending 24,550–24,580, but follow-through is weak.
Multiple FVGs (Fair Value Gaps) above; could act as magnets if price pushes up.
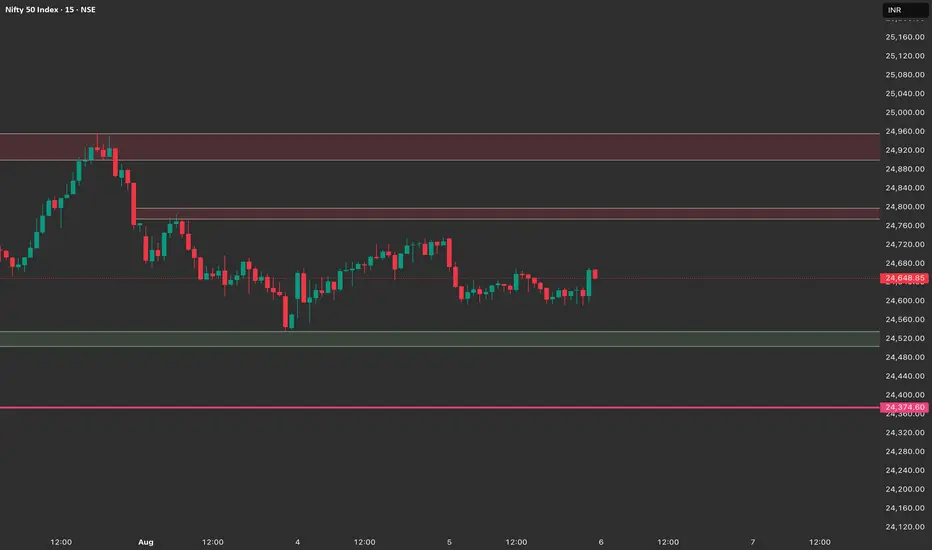
15M Chart
Microstructure: Attempted bounce from 24,560, but supply pressure visible near 24,720 – 24,760.
Short-term bullish recovery possible, but supply overhead is heavy.
Any strong rejection near 24,750 would confirm continuation lower.
📌 Trade Plan for Tomorrow (6th Aug)
Scenario 1 – Bearish Continuation (High Probability)
Entry: Short near 24,720 – 24,760 supply zone.
Stop Loss: Above 24,800 (recent swing high).
Targets:
T1: 24,560
T2: 24,400 – 24,420 (major liquidity sweep zone).
Rationale: Aligns with overall bearish 4H trend and rejection from supply.
Scenario 2 – Bullish Intraday Bounce (Only on Strong Rejection Wick)
Entry: Long near 24,520 – 24,560 demand zone if bullish engulfing / rejection wick forms.
Stop Loss: Below 24,480.
Targets:
T1: 24,720
T2: 24,880
Note: Counter-trend, keep position sizing small.
❌ No-Trade Zone
Avoid trading between 24,600 – 24,700 (current chop area).
Wait for price to either test supply (24,720–24,760) or demand (24,520–24,560) for clean entries.
✅ Summary:
Bias remains bearish.
Best trade for tomorrow: Look for short setups near 24,720–24,760 supply with targets towards 24,400–24,420. Go long only if we see a strong demand reaction near 24,520–24,560.
4H Chart
Trend Bias: Bearish → price is still making lower highs and lower lows.
Supply Zones:
24,880 – 24,940 (fresh supply, last bearish OB).
25,220 – 25,280 (major supply; high confluence).
Demand Zone:
24,520 – 24,560 (strong demand; multiple rejections).
Liquidity: Sell-side liquidity resting below 24,520, which may attract a sweep.
1H Chart
Price is consolidating between 24,520 (demand) and 24,880 (supply).
Recent bounce shows buyers defending 24,550–24,580, but follow-through is weak.
Multiple FVGs (Fair Value Gaps) above; could act as magnets if price pushes up.
15M Chart
Microstructure: Attempted bounce from 24,560, but supply pressure visible near 24,720 – 24,760.
Short-term bullish recovery possible, but supply overhead is heavy.
Any strong rejection near 24,750 would confirm continuation lower.
📌 Trade Plan for Tomorrow (6th Aug)
Scenario 1 – Bearish Continuation (High Probability)
Entry: Short near 24,720 – 24,760 supply zone.
Stop Loss: Above 24,800 (recent swing high).
Targets:
T1: 24,560
T2: 24,400 – 24,420 (major liquidity sweep zone).
Rationale: Aligns with overall bearish 4H trend and rejection from supply.
Scenario 2 – Bullish Intraday Bounce (Only on Strong Rejection Wick)
Entry: Long near 24,520 – 24,560 demand zone if bullish engulfing / rejection wick forms.
Stop Loss: Below 24,480.
Targets:
T1: 24,720
T2: 24,880
Note: Counter-trend, keep position sizing small.
❌ No-Trade Zone
Avoid trading between 24,600 – 24,700 (current chop area).
Wait for price to either test supply (24,720–24,760) or demand (24,520–24,560) for clean entries.
✅ Summary:
Bias remains bearish.
Best trade for tomorrow: Look for short setups near 24,720–24,760 supply with targets towards 24,400–24,420. Go long only if we see a strong demand reaction near 24,520–24,560.
Disclaimer
The information and publications are not meant to be, and do not constitute, financial, investment, trading, or other types of advice or recommendations supplied or endorsed by TradingView. Read more in the Terms of Use.
Disclaimer
The information and publications are not meant to be, and do not constitute, financial, investment, trading, or other types of advice or recommendations supplied or endorsed by TradingView. Read more in the Terms of Use.