The NIFTY 50 has broken below a key rising trendline, signaling a potential end to the recent bullish momentum. This breakdown is supported by price action, volume analysis, and open interest data, indicating a shift in market structure.
📊 Chart 1: OI + Volume Profile Insights
📈 Chart 2: Price Action + Volume Structure
⚙️ Trade Setups
🔻 Bearish Breakdown
🔁 Bullish Reversal
⚠️ Rangebound Watch
🧠 Summary
This is more than a minor dip — it's a technical structure break:
Unless the bulls reclaim 24,800+ soon, the path of least resistance appears downward.
💬 What’s your bias — breakdown or bounce? Share your view in the comments.
📊 Chart 1: OI + Volume Profile Insights
- Heavy Call OI buildup near 24,800–25,000, creating a strong resistance zone.
- Price rejected from this area and broke below the ascending trendline.
- Breakdown came with increased selling interest and a low volume node below 24,500, which could trigger a swift move downward.
- Multiple expiry OI clusters confirm the bearish bias in the near term.
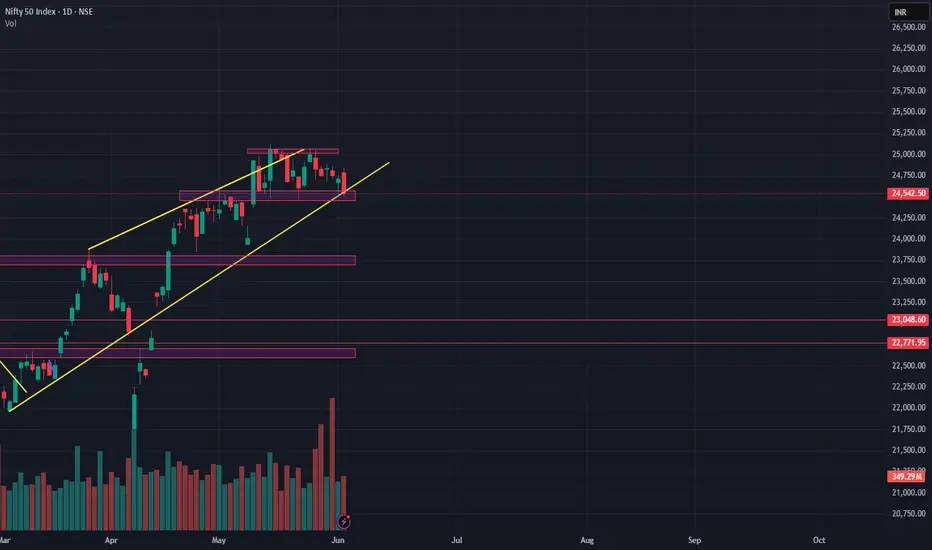
📈 Chart 2: Price Action + Volume Structure
- Rising channel/wedge decisively broken on high volume.
- Key support at 24,400–24,500 is being tested.
- Below this zone, next supports lie at:
23,750 (horizontal demand zone)
23,048 (Feb–March consolidation zone)
22,771 (weekly demand) - Volume indicates increased participation at the top — possibly distribution.
⚙️ Trade Setups
🔻 Bearish Breakdown
- Entry Trigger: Below 24,500
- Targets: 24,200 → 23,750 → 23,050
- Stop Loss: 24,620
🔁 Bullish Reversal
- Entry Trigger: Close above 24,800
- Targets: 25,000 → 25,200
- Stop Loss: 24,600
⚠️ Rangebound Watch
- Entry Trigger: Between 24,500–24,800
- Targets: Wait & react
- Stop Loss: –
🧠 Summary
This is more than a minor dip — it's a technical structure break:
- ✅ Trendline lost
- ✅ Rising wedge breakdown
- ✅ OI resistance above
- ✅ Volume confirming shift
Unless the bulls reclaim 24,800+ soon, the path of least resistance appears downward.
💬 What’s your bias — breakdown or bounce? Share your view in the comments.
Disclaimer
The information and publications are not meant to be, and do not constitute, financial, investment, trading, or other types of advice or recommendations supplied or endorsed by TradingView. Read more in the Terms of Use.
Disclaimer
The information and publications are not meant to be, and do not constitute, financial, investment, trading, or other types of advice or recommendations supplied or endorsed by TradingView. Read more in the Terms of Use.