Based on the charts and the market's performance on Tuesday, October 14, the Nifty experienced a sharp reversal from its high and a breakdown from a short-term consolidation, indicating a shift to a short-term corrective bias.
Detailed Market Structure Breakdown
4-Hour Chart (Macro Trend)
Structure: The Nifty is now in a corrective phase within its broader bullish trend. The sharp red candle on the 4H chart indicates that the 25,250 - 25,350 supply zone has held firm.
Key Levels:
Major Supply (Resistance): 25,180 - 25,250. This area is now the critical overhead hurdle, coinciding with the previous high and a fresh Order Block (OB).
Major Demand (Support): 25,000 - 25,050. This area includes the psychological 25,000 mark and a prior FVG (Fair Value Gap), serving as the must-hold zone to prevent a deeper correction.
Outlook: The trend has shifted to sideways-to-bearish. The market is expected to test the 25,000 support zone.
1-Hour Chart (Intermediate View)
Structure: The 1H chart shows a clear Break of Structure (BOS) to the downside. The price sold off sharply after failing to sustain the move above 25,250, breaking the immediate swing low and closing below the lower trendline of the ascending channel.
Key Levels:
Immediate Resistance: 25,180 (Prior support, now resistance).
Immediate Support: 25,050 (The lower boundary of the consolidation range).
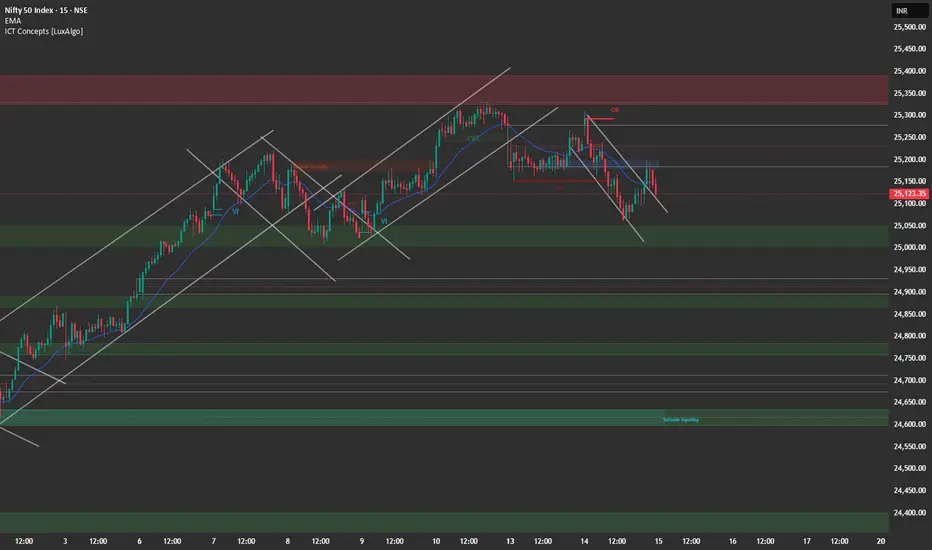
15-Minute Chart (Intraday View)
Structure: The 15M chart confirms the sharp selling pressure. The market broke out of a small consolidation range to the downside, confirming intraday bearish control. The index is currently moving within a small descending channel.
Key Levels:
Intraday Supply: 25,180.
Intraday Demand: 25,000.
Outlook: Bearish. A "Sell on Rise" strategy is recommended near 25,180.
📈 Trade Plan (Wednesday, 15th October)
Market Outlook: The Nifty is undergoing a sharp short-term correction. The primary strategy will be to sell into strength or on a breakdown of immediate support. Tech Mahindra and Persistent Systems Q2 results are due today, which will heavily influence the market.
Bearish Scenario (Primary Plan)
Justification: The market has confirmed a short-term reversal, and the structure is now corrective. Continuation toward the primary support is favored.
Entry: Short entry on a decisive break and 15-minute candle close below 25,050. Alternatively, short a retest and rejection of the 25,180 level.
Stop Loss (SL): Place a stop loss above 25,250 (above the immediate swing high/supply zone).
Targets:
T1: 25,000 (Psychological support).
T2: 24,900 (Major FVG support).
Bullish Scenario (Counter-Trend/Reversal Plan)
Justification: Only valid if Q2 results are exceptionally strong, leading to a strong move that negates the current selling pressure.
Trigger: A sustained move and close above the resistance at 25,250.
Entry: Long entry on a confirmed 15-minute close above 25,250.
Stop Loss (SL): Below 25,180.
Targets:
T1: 25,350 (Upper resistance).
T2: 25,450 (Previous high).
Key Levels for Observation:
Immediate Decision Point: 25,050 - 25,180 zone.
Bearish Confirmation: A break and sustained move below 25,050.
Bullish Confirmation: A move back above 25,250.
Line in the Sand: 25,000. Below this level, the short-term bullish bias is nullified.
Detailed Market Structure Breakdown
4-Hour Chart (Macro Trend)
Structure: The Nifty is now in a corrective phase within its broader bullish trend. The sharp red candle on the 4H chart indicates that the 25,250 - 25,350 supply zone has held firm.
Key Levels:
Major Supply (Resistance): 25,180 - 25,250. This area is now the critical overhead hurdle, coinciding with the previous high and a fresh Order Block (OB).
Major Demand (Support): 25,000 - 25,050. This area includes the psychological 25,000 mark and a prior FVG (Fair Value Gap), serving as the must-hold zone to prevent a deeper correction.
Outlook: The trend has shifted to sideways-to-bearish. The market is expected to test the 25,000 support zone.
1-Hour Chart (Intermediate View)
Structure: The 1H chart shows a clear Break of Structure (BOS) to the downside. The price sold off sharply after failing to sustain the move above 25,250, breaking the immediate swing low and closing below the lower trendline of the ascending channel.
Key Levels:
Immediate Resistance: 25,180 (Prior support, now resistance).
Immediate Support: 25,050 (The lower boundary of the consolidation range).
15-Minute Chart (Intraday View)
Structure: The 15M chart confirms the sharp selling pressure. The market broke out of a small consolidation range to the downside, confirming intraday bearish control. The index is currently moving within a small descending channel.
Key Levels:
Intraday Supply: 25,180.
Intraday Demand: 25,000.
Outlook: Bearish. A "Sell on Rise" strategy is recommended near 25,180.
📈 Trade Plan (Wednesday, 15th October)
Market Outlook: The Nifty is undergoing a sharp short-term correction. The primary strategy will be to sell into strength or on a breakdown of immediate support. Tech Mahindra and Persistent Systems Q2 results are due today, which will heavily influence the market.
Bearish Scenario (Primary Plan)
Justification: The market has confirmed a short-term reversal, and the structure is now corrective. Continuation toward the primary support is favored.
Entry: Short entry on a decisive break and 15-minute candle close below 25,050. Alternatively, short a retest and rejection of the 25,180 level.
Stop Loss (SL): Place a stop loss above 25,250 (above the immediate swing high/supply zone).
Targets:
T1: 25,000 (Psychological support).
T2: 24,900 (Major FVG support).
Bullish Scenario (Counter-Trend/Reversal Plan)
Justification: Only valid if Q2 results are exceptionally strong, leading to a strong move that negates the current selling pressure.
Trigger: A sustained move and close above the resistance at 25,250.
Entry: Long entry on a confirmed 15-minute close above 25,250.
Stop Loss (SL): Below 25,180.
Targets:
T1: 25,350 (Upper resistance).
T2: 25,450 (Previous high).
Key Levels for Observation:
Immediate Decision Point: 25,050 - 25,180 zone.
Bearish Confirmation: A break and sustained move below 25,050.
Bullish Confirmation: A move back above 25,250.
Line in the Sand: 25,000. Below this level, the short-term bullish bias is nullified.
Disclaimer
The information and publications are not meant to be, and do not constitute, financial, investment, trading, or other types of advice or recommendations supplied or endorsed by TradingView. Read more in the Terms of Use.
Disclaimer
The information and publications are not meant to be, and do not constitute, financial, investment, trading, or other types of advice or recommendations supplied or endorsed by TradingView. Read more in the Terms of Use.