Detailed Market Structure Breakdown
4-Hour Chart (Macro Trend)
Structure: The Nifty is now in a confirmed bullish bounce phase. The decisive move on Wednesday (Oct 1st) and the follow-through on Friday (Oct 3rd) have broken the steep descending channel shown in your charts. The market is now trading within a clear ascending channel, and the recent low at 24,600 looks like a significant bottom for the correction.
Key Levels:
Major Supply (Resistance): 25,000 - 25,150. This area is the next significant hurdle, aligning with the psychological 25,000 mark and prior consolidation/supply zones.
Major Demand (Support): 24,750 - 24,800. This area, which includes a FVG (Fair Value Gap) and the lower trendline of the new ascending channel, is the key support.
Outlook: The medium-term bias has shifted to cautiously bullish. The strategy is firmly "Buy on Dips" as long as the price holds above 24,700.
1-Hour Chart (Intermediate View)
Structure: The 1H chart shows an unmistakable Break of Structure (BOS) on the upside. The price has established a pattern of higher highs and higher lows and is confidently moving within the new ascending channel.
Key Levels:
Immediate Resistance: 24,950 (The high of Friday's consolidation).
Immediate Support: 24,800 (Lower boundary of the new ascending channel).
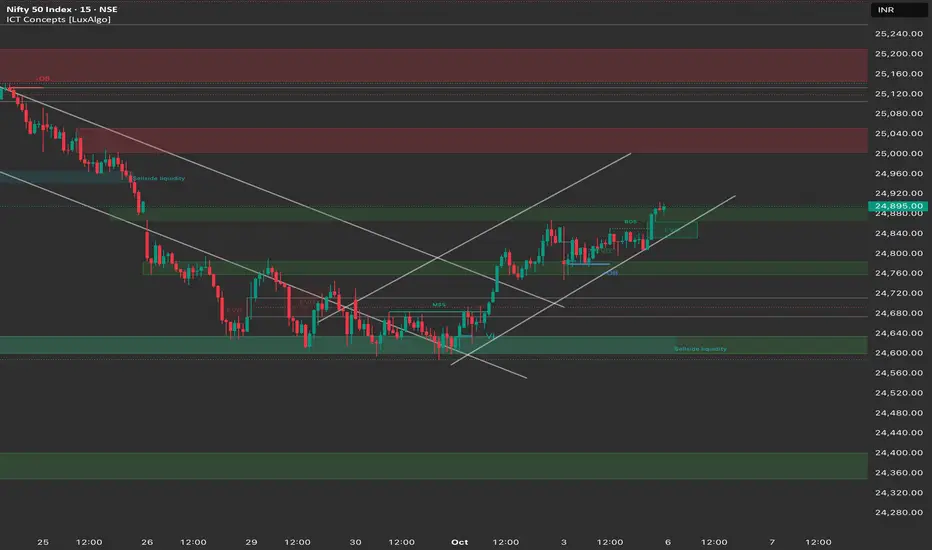
15-Minute Chart (Intraday View)
Structure: The 15M chart shows a clean continuation of the bullish momentum. After breaking out of the descending channel, the index consolidated beautifully in a tight flag pattern and moved higher. The market closed near its high, indicating strong control by the bulls.
Key Levels:
Intraday Supply: 24,950.
Intraday Demand: 24,850 - 24,800.
Outlook: Strongly Bullish.
📈 Trade Plan (Monday, 6th October)
Market Outlook: The Nifty is in a strong bounce phase with a clear bullish structure. The primary strategy will be to buy on dips or buy on continuation.
Bullish Scenario (Primary Plan)
Justification: The market structure is bullish on all timeframes, supported by the RBI catalyst and follow-through buying. The momentum favors a break of 25,000.
Entry: Long entry on a decisive break and 15-minute candle close above 24,950. Alternatively, look for a dip entry near 24,800 (the channel and FVG support zone).
Stop Loss (SL): Place a stop loss below 24,750 (below the key support and rising trendline).
Targets:
T1: 25,050 (Psychological resistance).
T2: 25,150 (Major supply zone).
T3: 25,250 (Extension target).
Bearish Scenario (Counter-Trend Plan)
Justification: This high-risk, counter-trend plan only becomes valid if the rally fails dramatically.
Trigger: A decisive break and 1-hour candle close below 24,700.
Entry: Short entry below 24,700.
Stop Loss (SL): Above 24,850 (above the rising trendline).
Targets:
T1: 24,600 (Recent swing low).
T2: 24,400 (Deeper demand zone).
Key Levels for Observation:
Immediate Decision Point: 24,900 - 25,000 zone.
Bullish Confirmation: A break and sustained move above 25,000.
Bearish Warning: A break below 24,750 suggests a failure of the bounce.
Line in the Sand: 24,700. Below this level, the short-term bias shifts back to neutral-to-bearish.
Disclaimer
The information and publications are not meant to be, and do not constitute, financial, investment, trading, or other types of advice or recommendations supplied or endorsed by TradingView. Read more in the Terms of Use.
Disclaimer
The information and publications are not meant to be, and do not constitute, financial, investment, trading, or other types of advice or recommendations supplied or endorsed by TradingView. Read more in the Terms of Use.