Based on the charts and the market's performance on Wednesday, October 30, the Nifty experienced a sharp reversal/correction in the last half of the session, pulling back significantly from the high established earlier in the day. The index closed below a critical short-term support level.
Detailed Market Structure Breakdown
4-Hour Chart (Macro Trend)
Structure: The Nifty is now in a Corrective Phase within its broader uptrend. The price broke out of the ascending channel to the upside in the morning but was aggressively rejected from the 26,100 - 26,200 supply zone (All-Time High area). The final 4H candle is a large bearish candle, confirming the Market Structure Shift (MSS) to the downside. The price closed right on the 9-period EMA (blue line on the chart).
Key Levels:
Major Supply (Resistance): 26,000 - 26,100. This area (the breakdown level and psychological mark) is the immediate overhead resistance.
Major Demand (Support): 25,750 - 25,800. This area, which includes the lower boundary of the previous steep channel and a key FVG (Fair Value Gap), is the must-hold zone for the medium-term rally.
Outlook: The short-term bias is Bearish. The sharp reversal suggests strong profit-booking, and the market is likely to seek lower support levels.
1-Hour Chart (Intermediate View)
Structure: The 1H chart clearly shows the massive selling pressure that followed the failure to break the high. The price has broken below the lower trendline of the immediate ascending channel and has formed a distinct descending channel during the last hours of trading.
Key Levels:
Immediate Resistance: 25,950 (The breakdown level and upper boundary of the descending channel).
Immediate Support: 25,750 - 25,800.
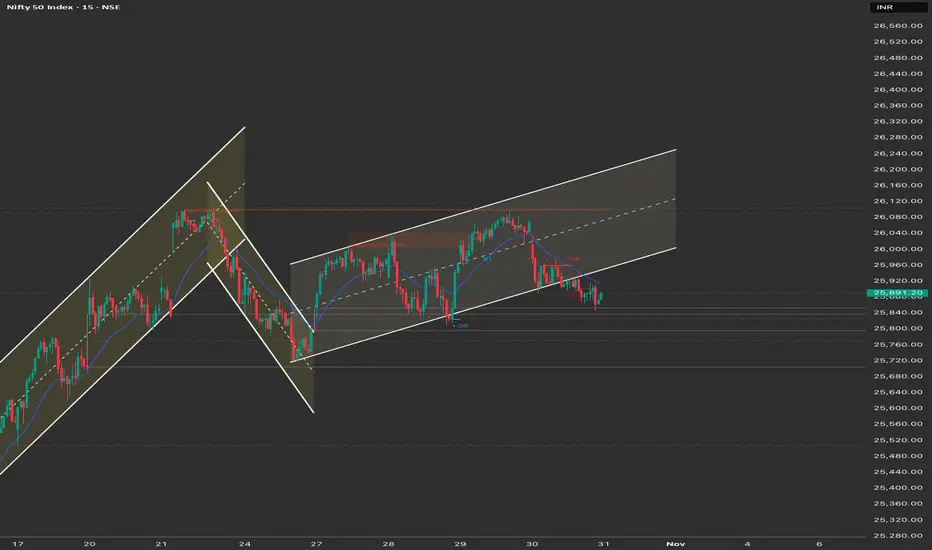
15-Minute Chart (Intraday View)
Structure: The 15M chart confirms the steep descending channel and strong intraday bearish control. The market closed near its low, indicating bears are dominant for the open.
Key Levels:
Intraday Supply: 25,950.
Intraday Demand: 25,750 - 25,800.
Outlook: Strongly Bearish for the session open. A "Sell on Rise" strategy is highly favored.
📈 Structure Analysis & Trade Plan: 31st October
Market Outlook: The Nifty witnessed an aggressive reversal after failing to make a new ATH. The primary strategy is to sell the breakdown or sell into any weak rise.
Bearish Scenario (Primary Plan: Correction Continuation)
Justification: The aggressive rejection from the supply zone and the breakdown of the short-term bullish structure favor continuation toward the main FVG support.
Entry: Short entry on a decisive break and 15-minute candle close below 25,750. Alternatively, short a retest and rejection of the 25,950 level (upper channel/FVG).
Stop Loss (SL): Place a stop loss above 26,100 (above the high of the breakdown).
Targets:
T1: 25,600 (Next major support).
T2: 25,400 - 25,500 (Major FVG demand zone).
Bullish Scenario (Counter-Trend/Reversal)
Justification: Only valid if the Fed decision was extremely dovish, leading to a strong gap-up that negates the current selling structure.
Trigger: A sustained move and close above 26,100.
Entry: Long entry on a confirmed 15-minute close above 26,100.
Stop Loss (SL): Below 25,900.
Targets:
T1: 26,277 (All-Time High retest).
T2: 26,500 (Extension target).
Key Levels for Observation:
Immediate Decision Point: 25,750 - 25,950 zone.
Bearish Confirmation: Sustained trade below 25,750.
Bullish Warning: A move back above 26,000.
Line in the Sand: 25,750. Below this level, the short-term bias is strongly bearish.
Detailed Market Structure Breakdown
4-Hour Chart (Macro Trend)
Structure: The Nifty is now in a Corrective Phase within its broader uptrend. The price broke out of the ascending channel to the upside in the morning but was aggressively rejected from the 26,100 - 26,200 supply zone (All-Time High area). The final 4H candle is a large bearish candle, confirming the Market Structure Shift (MSS) to the downside. The price closed right on the 9-period EMA (blue line on the chart).
Key Levels:
Major Supply (Resistance): 26,000 - 26,100. This area (the breakdown level and psychological mark) is the immediate overhead resistance.
Major Demand (Support): 25,750 - 25,800. This area, which includes the lower boundary of the previous steep channel and a key FVG (Fair Value Gap), is the must-hold zone for the medium-term rally.
Outlook: The short-term bias is Bearish. The sharp reversal suggests strong profit-booking, and the market is likely to seek lower support levels.
1-Hour Chart (Intermediate View)
Structure: The 1H chart clearly shows the massive selling pressure that followed the failure to break the high. The price has broken below the lower trendline of the immediate ascending channel and has formed a distinct descending channel during the last hours of trading.
Key Levels:
Immediate Resistance: 25,950 (The breakdown level and upper boundary of the descending channel).
Immediate Support: 25,750 - 25,800.
15-Minute Chart (Intraday View)
Structure: The 15M chart confirms the steep descending channel and strong intraday bearish control. The market closed near its low, indicating bears are dominant for the open.
Key Levels:
Intraday Supply: 25,950.
Intraday Demand: 25,750 - 25,800.
Outlook: Strongly Bearish for the session open. A "Sell on Rise" strategy is highly favored.
📈 Structure Analysis & Trade Plan: 31st October
Market Outlook: The Nifty witnessed an aggressive reversal after failing to make a new ATH. The primary strategy is to sell the breakdown or sell into any weak rise.
Bearish Scenario (Primary Plan: Correction Continuation)
Justification: The aggressive rejection from the supply zone and the breakdown of the short-term bullish structure favor continuation toward the main FVG support.
Entry: Short entry on a decisive break and 15-minute candle close below 25,750. Alternatively, short a retest and rejection of the 25,950 level (upper channel/FVG).
Stop Loss (SL): Place a stop loss above 26,100 (above the high of the breakdown).
Targets:
T1: 25,600 (Next major support).
T2: 25,400 - 25,500 (Major FVG demand zone).
Bullish Scenario (Counter-Trend/Reversal)
Justification: Only valid if the Fed decision was extremely dovish, leading to a strong gap-up that negates the current selling structure.
Trigger: A sustained move and close above 26,100.
Entry: Long entry on a confirmed 15-minute close above 26,100.
Stop Loss (SL): Below 25,900.
Targets:
T1: 26,277 (All-Time High retest).
T2: 26,500 (Extension target).
Key Levels for Observation:
Immediate Decision Point: 25,750 - 25,950 zone.
Bearish Confirmation: Sustained trade below 25,750.
Bullish Warning: A move back above 26,000.
Line in the Sand: 25,750. Below this level, the short-term bias is strongly bearish.
Disclaimer
The information and publications are not meant to be, and do not constitute, financial, investment, trading, or other types of advice or recommendations supplied or endorsed by TradingView. Read more in the Terms of Use.
Disclaimer
The information and publications are not meant to be, and do not constitute, financial, investment, trading, or other types of advice or recommendations supplied or endorsed by TradingView. Read more in the Terms of Use.