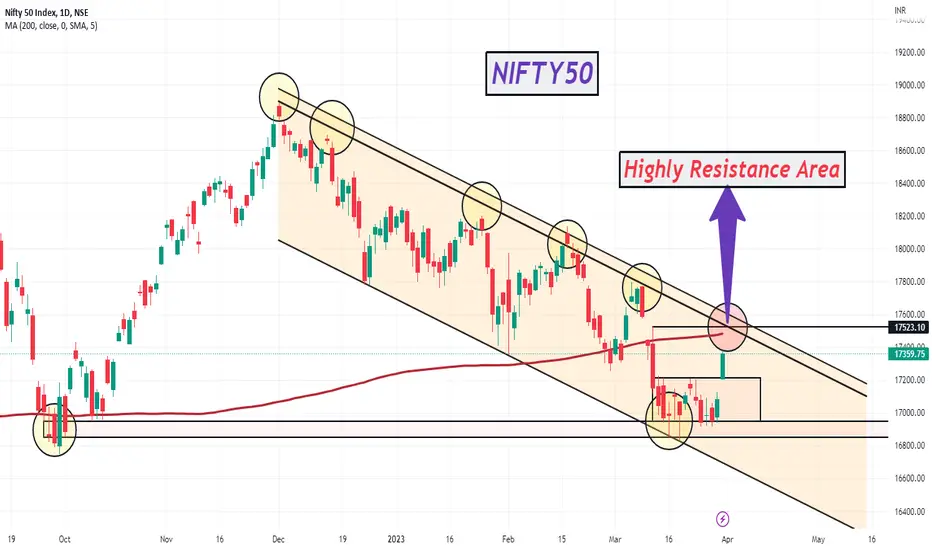
I would like to draw your attention to a critical level of resistance in the market. As you can see in the attached chart, there is a red circle which indicates a zone of high resistance. This resistance is primarily due to the 200-day moving average and the trend line of the zone.
In technical analysis, moving averages and trend lines are essential tools that traders use to identify key levels of support and resistance. The 200-day moving average is widely regarded as a significant level of support or resistance in the market. When the price of an asset is above the 200-day moving average, it is considered bullish, and when it is below, it is bearish.
Furthermore, the trend line of the zone adds to the strength of the resistance. The trend line is a line that connects the higher highs or lower lows of an asset, and it acts as a guide for traders to determine the trend direction.
Therefore, it is crucial to keep an eye on this resistance level as it could have a significant impact on the market's direction. If the price fails to break above this resistance, it could lead to a potential reversal or consolidation. On the other hand, if the price manages to break above this resistance, it could signal further bullish momentum.
In summary, as traders, we must pay close attention to the 200-day moving average and the trend line of the zone as they act as critical levels of resistance. Good luck with your trades!
For Learning Purpose.
Disclaimer
The information and publications are not meant to be, and do not constitute, financial, investment, trading, or other types of advice or recommendations supplied or endorsed by TradingView. Read more in the Terms of Use.
Disclaimer
The information and publications are not meant to be, and do not constitute, financial, investment, trading, or other types of advice or recommendations supplied or endorsed by TradingView. Read more in the Terms of Use.