# Here's a concise technical analysis of the NIFTY 50 Index based on the latest available data as of June 20, 2025:
-- Current Market Snapshot --
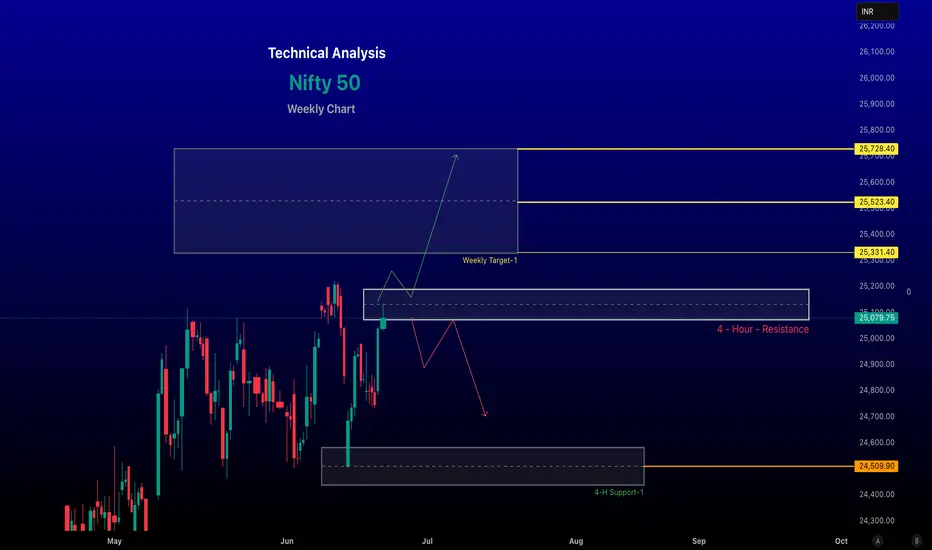
Closing Price: The NIFTY 50 closed at approximately 25,100, with a significant daily gain of over 1,046 points for the Sensex, indicating strong bullish momentum.
Recent Trend: The index has been trading within a tight consolidation range (24,350–25,250) since mid-May 2025, forming a rectangular pattern. A breakout above 25,100 could signal further upside.
Daily Movement: On June 18, the NIFTY rebounded strongly from an intraday low below 24,800, reclaiming 24,900, supported by broad-based buying across sectors like auto, financial services, FMCG, pharma, and realty.
Key Technical Levels
Resistance:
Immediate: 25,114–25,215 (crucial for bullish momentum). A sustained break above 25,215 could target 25,340–25,700.
Major: 25,484–25,600, where profit booking may occur.
Support:
Immediate: 24,400–24,600 (key to maintaining bullish bias).
Stronger: 24,600 (break below could attract short sellers) and 24,374 (major demand zone).
Historical Context: The index reached its all-time high of 26,277.35 on September 27, 2024, and is currently ~4.5% below that level
-- Disclaimer --
This analysis is based on recent technical data and market sentiment from web sources. It is for informational purposes only and not financial advice. Trading involves high risks, and past performance does not guarantee future results. Always conduct your own research or consult a SEBI-registered advisor before trading.
#Boost and comment will be highly appreciated
-- Current Market Snapshot --
Closing Price: The NIFTY 50 closed at approximately 25,100, with a significant daily gain of over 1,046 points for the Sensex, indicating strong bullish momentum.
Recent Trend: The index has been trading within a tight consolidation range (24,350–25,250) since mid-May 2025, forming a rectangular pattern. A breakout above 25,100 could signal further upside.
Daily Movement: On June 18, the NIFTY rebounded strongly from an intraday low below 24,800, reclaiming 24,900, supported by broad-based buying across sectors like auto, financial services, FMCG, pharma, and realty.
Key Technical Levels
Resistance:
Immediate: 25,114–25,215 (crucial for bullish momentum). A sustained break above 25,215 could target 25,340–25,700.
Major: 25,484–25,600, where profit booking may occur.
Support:
Immediate: 24,400–24,600 (key to maintaining bullish bias).
Stronger: 24,600 (break below could attract short sellers) and 24,374 (major demand zone).
Historical Context: The index reached its all-time high of 26,277.35 on September 27, 2024, and is currently ~4.5% below that level
-- Disclaimer --
This analysis is based on recent technical data and market sentiment from web sources. It is for informational purposes only and not financial advice. Trading involves high risks, and past performance does not guarantee future results. Always conduct your own research or consult a SEBI-registered advisor before trading.
#Boost and comment will be highly appreciated
Trade closed: target reached
renderwithme
Related publications
Disclaimer
The information and publications are not meant to be, and do not constitute, financial, investment, trading, or other types of advice or recommendations supplied or endorsed by TradingView. Read more in the Terms of Use.
renderwithme
Related publications
Disclaimer
The information and publications are not meant to be, and do not constitute, financial, investment, trading, or other types of advice or recommendations supplied or endorsed by TradingView. Read more in the Terms of Use.