Detailed Market Structure Breakdown
4-Hour Chart (Macro Trend)
Structure: The Nifty is showing a clear rejection from the major supply zone of 25,150 - 25,250. The strong red candle on the 4H chart (a potential Shooting Star/Bearish Engulfing pattern) indicates that the bounce phase is likely over, and the market is now retreating back into the consolidation range.
Key Levels:
Major Supply (Resistance): 25,150 - 25,250. This area remains the critical overhead hurdle.
Major Demand (Support): 24,800 - 24,900. This area includes a FVG (Fair Value Gap) and the lower boundary of the recent ascending channel. This is the must-hold zone for the bulls.
Outlook: The trend has shifted to sideways-to-bearish. The market is expected to test the 24,800 - 24,900 support zone.
1-Hour Chart (Intermediate View)
Structure: The 1H chart shows a clear Market Structure Shift (MSS) to the downside. The price broke the immediate swing low after being rejected from the 25,200 level. The index has now broken the lower trendline of the recent ascending channel, confirming the shift to a corrective short-term trend.
Key Levels:
Immediate Resistance: 25,100 (Prior consolidation support, now resistance).
Immediate Support: 24,980 - 25,000 (The psychological level and Friday's close area).
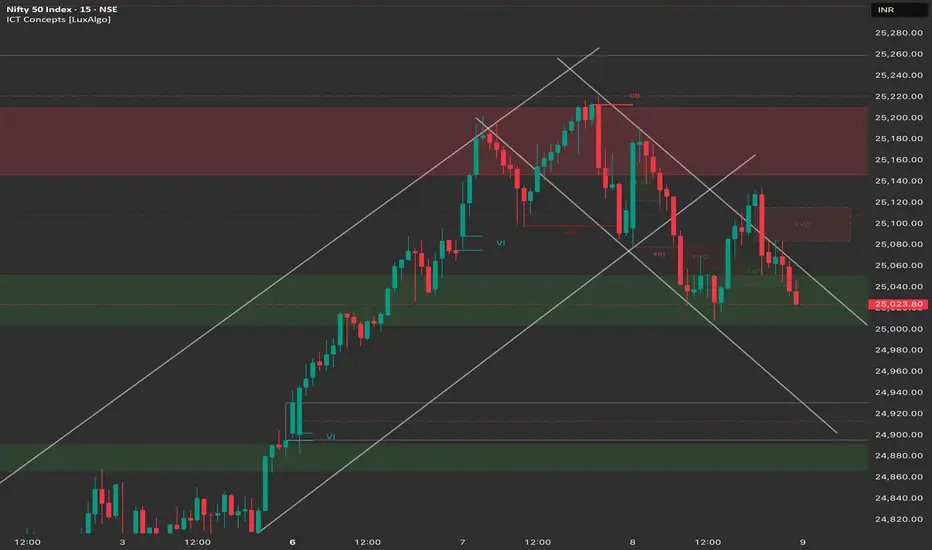
15-Minute Chart (Intraday View)
Structure: The 15M chart shows a clean descending pattern since the 25,200 high, marked by lower highs and lower lows. The market closed below the 25,050 mark, indicating bears are in control.
Key Levels:
Intraday Supply: 25,080 (Immediate swing high).
Intraday Demand: 24,900 - 24,950.
Outlook: Bearish. A "Sell on Rise" strategy is recommended near 25,080 - 25,100.
📈 Trade Plan (Thursday, 9th October)
Market Outlook: The Nifty has shifted to a bearish bias after hitting major resistance. TCS Q2 results are due today, which will heavily influence Nifty IT and potentially the entire index. The plan should be reactive to the continuation of the correction.
Bearish Scenario (Primary Plan)
Justification: The breakdown of the ascending channel and the rejection from the major 25,200 supply zone favors a continuation of the correction, especially if TCS results disappoint.
Entry: Short entry on a decisive break and 15-minute candle close below 24,980 (breaking the psychological and swing support). Alternatively, short a retest and rejection of the 25,080 level.
Stop Loss (SL): Place a stop loss above 25,150 (above the immediate swing high).
Targets:
T1: 24,880 (Major FVG support).
T2: 24,800 (Lower boundary of macro support).
T3: 24,700 (Extension target).
Bullish Scenario (Counter-Trend/Reversal Plan)
Justification: Only valid if TCS results are exceptionally strong, leading to a gap-up or sharp reversal.
Trigger: A sustained move and close above the major resistance at 25,250.
Entry: Long entry on a confirmed 15-minute close above 25,250.
Stop Loss (SL): Below 25,150.
Targets:
T1: 25,350 (Upper resistance).
T2: 25,450 (Previous high).
Key Levels for Observation:
Immediate Decision Point: 25,080 - 25,100 zone.
Bearish Confirmation: A break and sustained move below 24,980.
Bullish Confirmation: A move back above 25,150.
Line in the Sand: 24,800. A break below this would accelerate the correction.
4-Hour Chart (Macro Trend)
Structure: The Nifty is showing a clear rejection from the major supply zone of 25,150 - 25,250. The strong red candle on the 4H chart (a potential Shooting Star/Bearish Engulfing pattern) indicates that the bounce phase is likely over, and the market is now retreating back into the consolidation range.
Key Levels:
Major Supply (Resistance): 25,150 - 25,250. This area remains the critical overhead hurdle.
Major Demand (Support): 24,800 - 24,900. This area includes a FVG (Fair Value Gap) and the lower boundary of the recent ascending channel. This is the must-hold zone for the bulls.
Outlook: The trend has shifted to sideways-to-bearish. The market is expected to test the 24,800 - 24,900 support zone.
1-Hour Chart (Intermediate View)
Structure: The 1H chart shows a clear Market Structure Shift (MSS) to the downside. The price broke the immediate swing low after being rejected from the 25,200 level. The index has now broken the lower trendline of the recent ascending channel, confirming the shift to a corrective short-term trend.
Key Levels:
Immediate Resistance: 25,100 (Prior consolidation support, now resistance).
Immediate Support: 24,980 - 25,000 (The psychological level and Friday's close area).
15-Minute Chart (Intraday View)
Structure: The 15M chart shows a clean descending pattern since the 25,200 high, marked by lower highs and lower lows. The market closed below the 25,050 mark, indicating bears are in control.
Key Levels:
Intraday Supply: 25,080 (Immediate swing high).
Intraday Demand: 24,900 - 24,950.
Outlook: Bearish. A "Sell on Rise" strategy is recommended near 25,080 - 25,100.
📈 Trade Plan (Thursday, 9th October)
Market Outlook: The Nifty has shifted to a bearish bias after hitting major resistance. TCS Q2 results are due today, which will heavily influence Nifty IT and potentially the entire index. The plan should be reactive to the continuation of the correction.
Bearish Scenario (Primary Plan)
Justification: The breakdown of the ascending channel and the rejection from the major 25,200 supply zone favors a continuation of the correction, especially if TCS results disappoint.
Entry: Short entry on a decisive break and 15-minute candle close below 24,980 (breaking the psychological and swing support). Alternatively, short a retest and rejection of the 25,080 level.
Stop Loss (SL): Place a stop loss above 25,150 (above the immediate swing high).
Targets:
T1: 24,880 (Major FVG support).
T2: 24,800 (Lower boundary of macro support).
T3: 24,700 (Extension target).
Bullish Scenario (Counter-Trend/Reversal Plan)
Justification: Only valid if TCS results are exceptionally strong, leading to a gap-up or sharp reversal.
Trigger: A sustained move and close above the major resistance at 25,250.
Entry: Long entry on a confirmed 15-minute close above 25,250.
Stop Loss (SL): Below 25,150.
Targets:
T1: 25,350 (Upper resistance).
T2: 25,450 (Previous high).
Key Levels for Observation:
Immediate Decision Point: 25,080 - 25,100 zone.
Bearish Confirmation: A break and sustained move below 24,980.
Bullish Confirmation: A move back above 25,150.
Line in the Sand: 24,800. A break below this would accelerate the correction.
Disclaimer
The information and publications are not meant to be, and do not constitute, financial, investment, trading, or other types of advice or recommendations supplied or endorsed by TradingView. Read more in the Terms of Use.
Disclaimer
The information and publications are not meant to be, and do not constitute, financial, investment, trading, or other types of advice or recommendations supplied or endorsed by TradingView. Read more in the Terms of Use.