🔎 4H Chart (Swing Bias)
Strong downtrend from 25,200 → series of lower highs & lower lows.
Price reclaimed from 24,400 demand zone and is now retesting FVG around 24,600–24,650.
Overhead supply at 24,800–25,000 remains untested → still bearish higher-timeframe bias unless broken.
Momentum: Relief rally inside downtrend channel.
Bias: Short-term pullback possible, but broader trend still bearish.
⏱ 1H Chart (Intraday Bias)
Clear channel breakout on upside; price now consolidating above 24,600.
First FVG (24,600–24,650) being tested; possible extension toward 24,750–24,800 resistance.
Volume imbalance + liquidity sweep visible near 24,550 → confirms buyers stepping in.
EMA slope still downward, so rally = corrective, not reversal yet.
Bias: Bullish intraday until 24,750–24,800 supply zone.
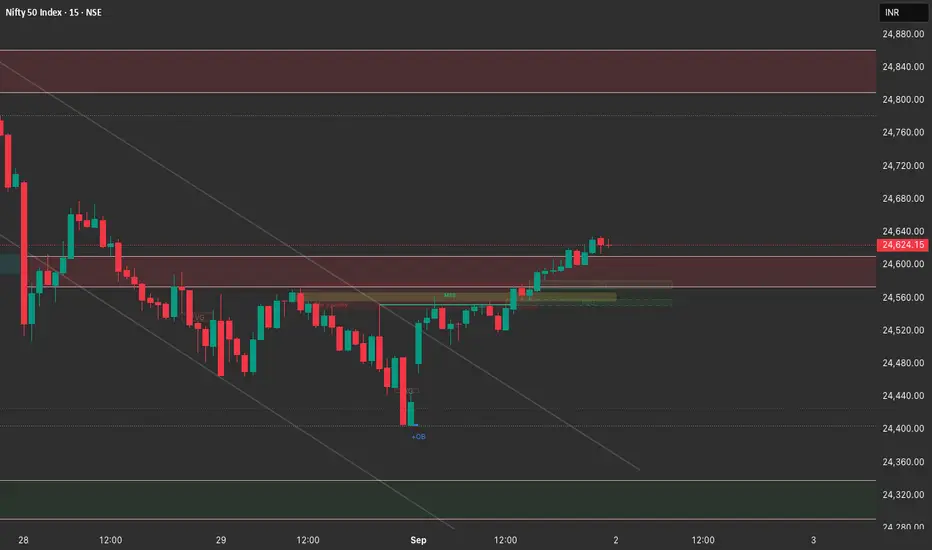
🕒 15M Chart (Execution Lens)
Price showing BOS (Break of Structure) → minor bullish structure shift.
Liquidity grab below 24,500, followed by impulsive rally = signs of accumulation.
Immediate intraday OB/FVG support at 24,550–24,580.
Resistance supply zone: 24,700–24,750 (first test).
Bias: Intraday longs until 24,700–24,750. Beyond that, cautious.
📑 Trade Plan for 2nd September
✅ Long Setup
Entry Zone: 24,550–24,580 (pullback into OB/FVG).
Target 1: 24,700
Target 2: 24,750–24,800
Stop Loss: Below 24,480 (swing low).
Risk–Reward: ~1:2
❌ Short Setup (if rejection seen)
Entry Zone: 24,750–24,800 (supply/FVG).
Target 1: 24,600
Target 2: 24,450
Stop Loss: Above 24,850
Risk–Reward: ~1:2
📌 Summary:
For 2nd Sept, Nifty is in a corrective bullish move inside a bearish trend. Best approach is to buy dips till 24,750–24,800, then watch for rejection signs to flip short.
Strong downtrend from 25,200 → series of lower highs & lower lows.
Price reclaimed from 24,400 demand zone and is now retesting FVG around 24,600–24,650.
Overhead supply at 24,800–25,000 remains untested → still bearish higher-timeframe bias unless broken.
Momentum: Relief rally inside downtrend channel.
Bias: Short-term pullback possible, but broader trend still bearish.
⏱ 1H Chart (Intraday Bias)
Clear channel breakout on upside; price now consolidating above 24,600.
First FVG (24,600–24,650) being tested; possible extension toward 24,750–24,800 resistance.
Volume imbalance + liquidity sweep visible near 24,550 → confirms buyers stepping in.
EMA slope still downward, so rally = corrective, not reversal yet.
Bias: Bullish intraday until 24,750–24,800 supply zone.
🕒 15M Chart (Execution Lens)
Price showing BOS (Break of Structure) → minor bullish structure shift.
Liquidity grab below 24,500, followed by impulsive rally = signs of accumulation.
Immediate intraday OB/FVG support at 24,550–24,580.
Resistance supply zone: 24,700–24,750 (first test).
Bias: Intraday longs until 24,700–24,750. Beyond that, cautious.
📑 Trade Plan for 2nd September
✅ Long Setup
Entry Zone: 24,550–24,580 (pullback into OB/FVG).
Target 1: 24,700
Target 2: 24,750–24,800
Stop Loss: Below 24,480 (swing low).
Risk–Reward: ~1:2
❌ Short Setup (if rejection seen)
Entry Zone: 24,750–24,800 (supply/FVG).
Target 1: 24,600
Target 2: 24,450
Stop Loss: Above 24,850
Risk–Reward: ~1:2
📌 Summary:
For 2nd Sept, Nifty is in a corrective bullish move inside a bearish trend. Best approach is to buy dips till 24,750–24,800, then watch for rejection signs to flip short.
Disclaimer
The information and publications are not meant to be, and do not constitute, financial, investment, trading, or other types of advice or recommendations supplied or endorsed by TradingView. Read more in the Terms of Use.
Disclaimer
The information and publications are not meant to be, and do not constitute, financial, investment, trading, or other types of advice or recommendations supplied or endorsed by TradingView. Read more in the Terms of Use.