Sharing my current outlook on Nikkei futures with a simple but effective read. 📈
**🎯 My Expectation:**
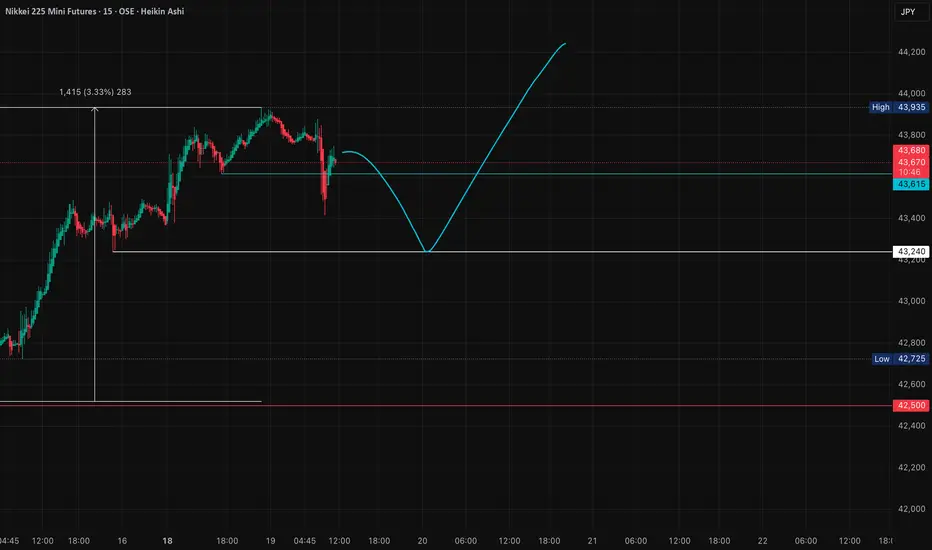
I'm anticipating a classic liquidity grab below recent lows, followed by another leg higher. After this move, we might see a more significant corrective pullback. 📉
**📍 Target Zone:**
A move up to around 44,500 would provide an ideal setup. This level would create what looks like the second touch of a potential double top pattern - that's where I'm planning to take profits. 🎯
**🧠 Market Structure Logic:**
This type of move is textbook market behavior: sweep the weak hands out with a liquidity grab below support, then drive price higher to collect stops above resistance. Simple, but effective. 🔄
**⚠️ What I'm Watching:**
- Clean break below recent lows (liquidity hunt)
- Quick reversal and momentum shift upward
- Approach to the 44,500 area for potential double top formation
**📊 Risk Consideration:**
If we don't see the expected liquidity grab first, or if price breaks structure in an unexpected way, I'll reassess the setup. The beauty of having a plan is knowing when it's not working. 🛑
---
**Trading is simple.** You don't need multiple indicators or dozens of lines on your chart. A clean and simple chart often works best — it keeps your decisions consistent and reduces uncertainty. Sure, it might not look flashy, and my analysis may seem a bit "plain" compared to others… but that's how I like it. If you find this analysis useful, feel free to follow me for more updates.
---
*Disclaimer: This post is for general informational and educational purposes only. It does not constitute financial advice, investment recommendation, or a service targeting specific investors, and should not be considered illegal or restricted information in any jurisdiction.*
**🎯 My Expectation:**
I'm anticipating a classic liquidity grab below recent lows, followed by another leg higher. After this move, we might see a more significant corrective pullback. 📉
**📍 Target Zone:**
A move up to around 44,500 would provide an ideal setup. This level would create what looks like the second touch of a potential double top pattern - that's where I'm planning to take profits. 🎯
**🧠 Market Structure Logic:**
This type of move is textbook market behavior: sweep the weak hands out with a liquidity grab below support, then drive price higher to collect stops above resistance. Simple, but effective. 🔄
**⚠️ What I'm Watching:**
- Clean break below recent lows (liquidity hunt)
- Quick reversal and momentum shift upward
- Approach to the 44,500 area for potential double top formation
**📊 Risk Consideration:**
If we don't see the expected liquidity grab first, or if price breaks structure in an unexpected way, I'll reassess the setup. The beauty of having a plan is knowing when it's not working. 🛑
---
**Trading is simple.** You don't need multiple indicators or dozens of lines on your chart. A clean and simple chart often works best — it keeps your decisions consistent and reduces uncertainty. Sure, it might not look flashy, and my analysis may seem a bit "plain" compared to others… but that's how I like it. If you find this analysis useful, feel free to follow me for more updates.
---
*Disclaimer: This post is for general informational and educational purposes only. It does not constitute financial advice, investment recommendation, or a service targeting specific investors, and should not be considered illegal or restricted information in any jurisdiction.*
Trade active
LONG🔥Trade closed manually
It seems like it will fall to 40,830 within the next few days.Disclaimer
The information and publications are not meant to be, and do not constitute, financial, investment, trading, or other types of advice or recommendations supplied or endorsed by TradingView. Read more in the Terms of Use.
Disclaimer
The information and publications are not meant to be, and do not constitute, financial, investment, trading, or other types of advice or recommendations supplied or endorsed by TradingView. Read more in the Terms of Use.