Hello, traders!
Follow me to get the latest information quickly.
Have a great day!
-------------------------------------
(NVDA 1M chart)
The basic trading strategy is to buy in the DOM(-60) ~ HA-Low range and sell in the HA-High ~ DOM(60) range.
However, if the price rises from the HA-High to DOM(60) range, a step-like uptrend is likely, while if it falls from the DOM(-60) to HA-Low range, a step-like downtrend is likely.
Therefore, the basic trading strategy should be a segmented trading strategy.
-
Looking at the current 1M chart, the HA-High to DOM(60) range is 121.80-138.23.
Therefore, if the price holds above 121.80-138.23, the step-like uptrend is likely to continue.
The left Fibonacci ratio was drawn in the first wave, and the key is whether the price can rise above 3.618 (181.85) and hold.
The right Fibonacci ratio was drawn in the second wave, and the key is whether the price can rise above 1 (198.88).
Therefore, the key question is whether the price can break above the 181.85-198.88 range.
If the price fails to rise,
1st: 152.89
2nd: 121.80-138.23
We need to check for support near the 1st and 2nd levels above.
-
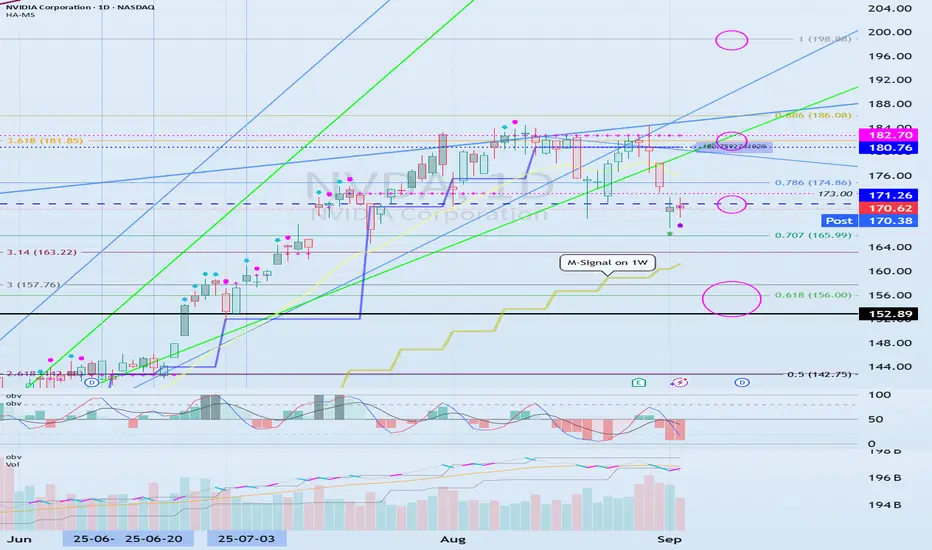
(1D chart)
The HA-High ~ DOM(60) range on the 1D chart is 180.76-182.70.
Therefore, for a stepwise uptrend to begin, the price must rise above 180.76-182.70 and maintain its position.
The 171.26 level is the HA-High indicator level on the 1W chart.
Therefore, the key question is whether support is found near 171.26.
If it falls below 171.26, it is likely to decline until it meets the M-Signal indicator on the 1W chart.
At this point, the key is whether it can find support near 152.89, the Fibonacci 3 level (157.76) to the left.
If it falls below the M-Signal indicator on the 1W chart, there is a possibility of a downtrend, so you should consider a response plan.
------------------------------------------------
If this is your first time hearing this explanation, you may not understand what I'm talking about.
The important thing is that the DOM(-60) and HA-Low indicators indicate lows, while the DOM(60) and HA-High indicators indicate highs.
Therefore, buys should be made near the DOM(-60) and HA-Low indicators, and sells should be made near the DOM(60) and HA-High indicators.
To interpret charts from a long-term perspective, you need to check the positions of the DOM(-60), HA-Low, HA-High, and DOM(60) indicators on the 1M chart.
The 1W chart is interpreted from a medium- to long-term perspective, while the 1D chart is interpreted from a short-term perspective.
In the stock market, price fluctuations are often driven by issues other than the chart itself, so it's important to always be aware of volatility.
Even so, since volatility ultimately occurs after the chart is created, it's best to analyze the chart first and then examine other issues.
Otherwise, you'll likely end up creating a trading strategy that heavily reflects your own subjective opinions.
-
Thank you for reading to the end.
I wish you successful trading.
--------------------------------------------------
※ Follow X to check out the posts.
※ X를 팔로우하고 게시물을 확인하세요.
◆ t.me/readCryptoChannel
[HA-MS Indicator]
bit.ly/3YxHgvN
[OBV Indicator]
bit.ly/4dcyny3
※ X를 팔로우하고 게시물을 확인하세요.
◆ t.me/readCryptoChannel
[HA-MS Indicator]
bit.ly/3YxHgvN
[OBV Indicator]
bit.ly/4dcyny3
Disclaimer
The information and publications are not meant to be, and do not constitute, financial, investment, trading, or other types of advice or recommendations supplied or endorsed by TradingView. Read more in the Terms of Use.
