🔍 Introduction
This analysis starts from the 1-hour timeframe, where price action shows signs of exhaustion at the tail end of a 5-wave decline. A classic ending diagonal in wave c, along with bullish RSI divergence, points toward a potential short-term reversal — possibly the start of Wave B in a larger A-B-C corrective structure. We then zoom out to place this setup within a broader W-X-Y correction that began from the 13,220 high.
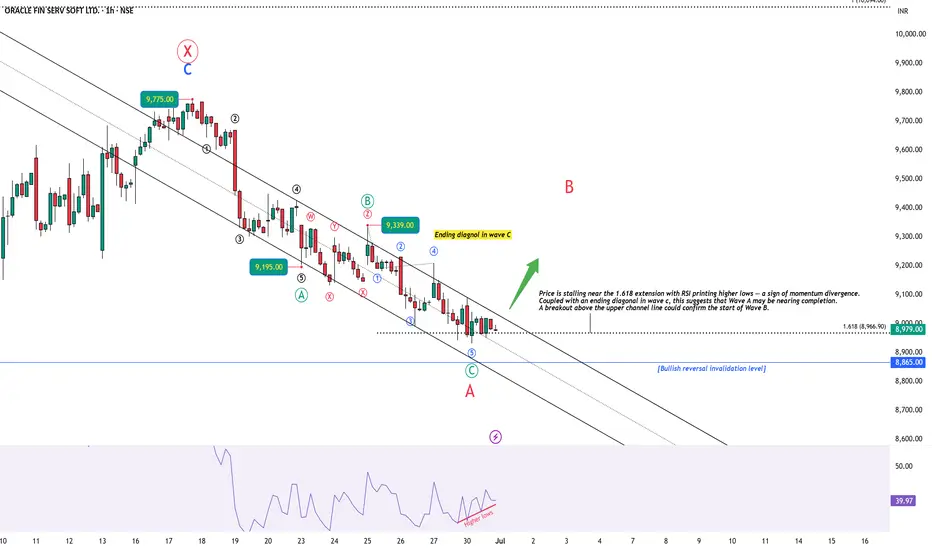
🕐 1H Chart: Ending Diagonal + RSI Divergence into Key Zone
Following the peak at 9775, price has been declining in what appears to be a ABC zigzag correction. Subwave 5 (within wave c) exhibits ending diagonal behavior, with overlapping internals and weakening thrust. Importantly, RSI has been printing higher lows, diverging strongly against lower price lows — a signal of potential bottoming.
Price is also testing the 1.618 Fibonacci extension level. A decisive breakout above the upper trendline would confirm a likely transition into Wave B.
📆 Daily Chart: W-X-Y Structure from 13,220 High
Zooming out, ORACLE FIN SERV is unfolding a W-X-Y correction from its 13,220 high:

🧠 Conclusion & Key Levels to Watch
Wave A of Y appears to be nearing completion, supported by:
A breakout above the channel could mark the start of Wave B — potentially retracing 38–61.8% of the drop from 9775
📌 This setup offers both short-term and structural clues. I’ll post follow-ups as this unfolds.
⚠️ Disclaimer
This post is for educational purposes only and does not constitute financial advice. Please do your own research and manage risk appropriately.
This analysis starts from the 1-hour timeframe, where price action shows signs of exhaustion at the tail end of a 5-wave decline. A classic ending diagonal in wave c, along with bullish RSI divergence, points toward a potential short-term reversal — possibly the start of Wave B in a larger A-B-C corrective structure. We then zoom out to place this setup within a broader W-X-Y correction that began from the 13,220 high.
🕐 1H Chart: Ending Diagonal + RSI Divergence into Key Zone
Following the peak at 9775, price has been declining in what appears to be a ABC zigzag correction. Subwave 5 (within wave c) exhibits ending diagonal behavior, with overlapping internals and weakening thrust. Importantly, RSI has been printing higher lows, diverging strongly against lower price lows — a signal of potential bottoming.
Price is also testing the 1.618 Fibonacci extension level. A decisive breakout above the upper trendline would confirm a likely transition into Wave B.
🟢 Watching closely for a decisive breakout / close above the channel.
📆 Daily Chart: W-X-Y Structure from 13,220 High
Zooming out, ORACLE FIN SERV is unfolding a W-X-Y correction from its 13,220 high:
- Wave W completed as a zigzag down to 7038.
- Wave X unfolded as a zigzag rally, peaking at 9775. Notably, Wave C of X did not reach 100% of Wave A — signaling internal weakness.
- Wave Y is now developing as a red A-B-C structure, with Wave A possibly ending near the 8930 level.
🧠 Conclusion & Key Levels to Watch
Wave A of Y appears to be nearing completion, supported by:
- Ending diagonal structure in wave C (1H)
- RSI bullish divergence
- Price stalling at 1.618 extension
A breakout above the channel could mark the start of Wave B — potentially retracing 38–61.8% of the drop from 9775
📌 This setup offers both short-term and structural clues. I’ll post follow-ups as this unfolds.
⚠️ Disclaimer
This post is for educational purposes only and does not constitute financial advice. Please do your own research and manage risk appropriately.
WaveXplorer | Elliott Wave insights
📊 X profile: @veerappa89
📊 X profile: @veerappa89
Disclaimer
The information and publications are not meant to be, and do not constitute, financial, investment, trading, or other types of advice or recommendations supplied or endorsed by TradingView. Read more in the Terms of Use.