ORCL Friday Setup – Bulls Regain Control Above $306 as Gamma Builds for a Breakout
🕒 1. Daily Chart – Macro Structure (“The Why”)
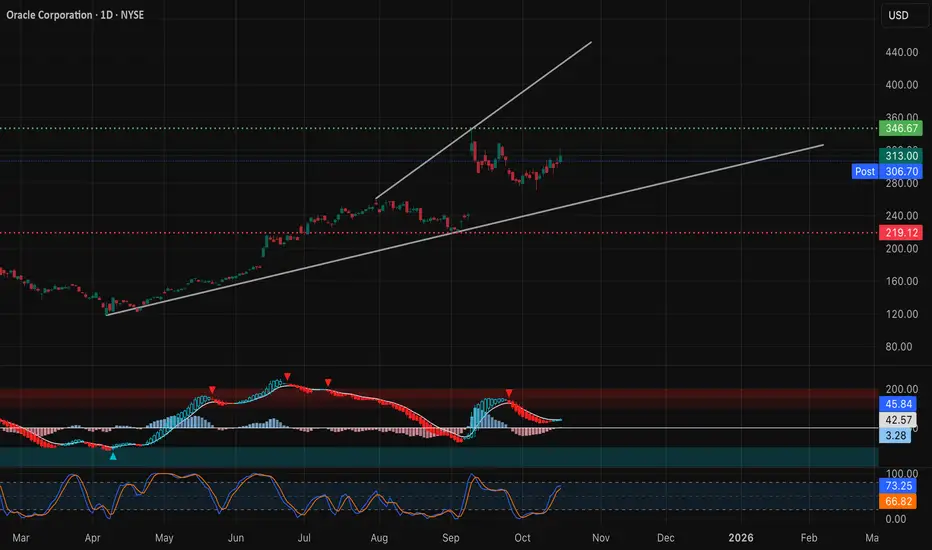
Oracle (ORCL) has reawakened after a month-long consolidation, staging a clean CHoCH → BOS sequence off the $276 base. The recent daily ‘Buy’ trigger aligns with renewed momentum above the trendline that has guided the broader uptrend since May.
The macro structure remains firmly bullish. Price is currently retesting the prior breakout area around $306–$313, sitting just beneath the upper channel resistance at $322–$325. The higher-timeframe chart suggests the recent correction phase is ending, and a continuation pattern is forming.
Macro Bias: Bullish, with $299–$306 acting as a critical demand reaccumulation zone before a potential leg higher toward $322+.
⏰ 2. 1-Hour Chart – Active Market Structure (“The Setup”)

On the 1-hour chart, ORCL continues to form a well-defined ascending structure. Recent price action shows multiple BOS levels confirmed, followed by a minor CHoCH pullback that tapped the intraday trendline near $305–$306 — now acting as dynamic support.
The MACD remains positive, though histogram momentum has cooled — typical of mid-trend pauses before continuation. The Stoch RSI is cycling from oversold levels, suggesting fresh buying pressure may enter if $305 continues to hold.
Both 9 EMA and 21 EMA remain upward-sloping, supporting a bullish short-term bias. Any retest of the 9 EMA around $305–$306 could attract dip buyers.
Key Levels:
* Support: $305 → $299 → $295
* Resistance: $311 → $314 → $322
💹 3. 15-Min Chart – Intraday Execution (“The How”)

On the 15-min timeframe, ORCL recently printed a BOS to the upside followed by a controlled retracement — classic breakout–retest structure. The stock found demand at $305–$306, creating a liquidity sweep below the short-term low and reclaiming support swiftly — a bullish tell heading into Friday.
MACD histogram is turning back toward positive territory, and Stoch RSI is lifting from the lower zone, signaling potential continuation momentum if volume confirms.
Scalp Plan:
* Bullish Entry: Above $308, target $311.5 → $314, stop below $305.5
* Bearish Scenario: Failure to hold $305 with volume; target $299 → $295, stop above $308.5
Momentum traders should monitor the intraday EMA alignment — a bullish cross and retest setup here could set up a strong Friday run.
📈 4. GEX (Gamma Exposure) Chart – Dealer Positioning (“The Fuel”)

Option flow and gamma positioning support the bullish structure. The highest positive GEX and call resistance cluster sits near $312–$322, matching the same upper technical resistance seen on the charts. The HVL zone at $306–$307 aligns perfectly with the current price — a magnetic gamma pivot area that dealers will likely defend into expiration.
* Positive Gamma: $312 → $322 (call side, upside cap until squeeze)
* Put Support: $295 → $290 (negative gamma pocket, volatility risk if lost)
* IVR: 67.4
* IVx avg: 67.1
* Call Bias: 31.4%
Dealer positioning indicates controlled gamma above $306, but once $311–$314 is breached, hedging could flip bullish — setting up a clean gamma squeeze into $320+.
🎯 Final Outlook
Friday’s tone for ORCL favors continuation as long as $305 holds as intraday demand. A reclaim of $311+ could trigger fast upside momentum into $314–$322, especially if SPY or QQQ maintain strength into the session. Failure to defend $305, however, would open a retest of $299 — the key line in the sand for bulls.
I’m watching for a morning liquidity sweep under $305 followed by a reclaim as the ideal entry trigger. If that happens with MACD confirmation and rising volume, this could be a textbook Friday continuation play.
Disclaimer: This analysis is for educational purposes only and not financial advice. Always do your own research and trade responsibly.
🕒 1. Daily Chart – Macro Structure (“The Why”)
Oracle (ORCL) has reawakened after a month-long consolidation, staging a clean CHoCH → BOS sequence off the $276 base. The recent daily ‘Buy’ trigger aligns with renewed momentum above the trendline that has guided the broader uptrend since May.
The macro structure remains firmly bullish. Price is currently retesting the prior breakout area around $306–$313, sitting just beneath the upper channel resistance at $322–$325. The higher-timeframe chart suggests the recent correction phase is ending, and a continuation pattern is forming.
Macro Bias: Bullish, with $299–$306 acting as a critical demand reaccumulation zone before a potential leg higher toward $322+.
⏰ 2. 1-Hour Chart – Active Market Structure (“The Setup”)
On the 1-hour chart, ORCL continues to form a well-defined ascending structure. Recent price action shows multiple BOS levels confirmed, followed by a minor CHoCH pullback that tapped the intraday trendline near $305–$306 — now acting as dynamic support.
The MACD remains positive, though histogram momentum has cooled — typical of mid-trend pauses before continuation. The Stoch RSI is cycling from oversold levels, suggesting fresh buying pressure may enter if $305 continues to hold.
Both 9 EMA and 21 EMA remain upward-sloping, supporting a bullish short-term bias. Any retest of the 9 EMA around $305–$306 could attract dip buyers.
Key Levels:
* Support: $305 → $299 → $295
* Resistance: $311 → $314 → $322
💹 3. 15-Min Chart – Intraday Execution (“The How”)
On the 15-min timeframe, ORCL recently printed a BOS to the upside followed by a controlled retracement — classic breakout–retest structure. The stock found demand at $305–$306, creating a liquidity sweep below the short-term low and reclaiming support swiftly — a bullish tell heading into Friday.
MACD histogram is turning back toward positive territory, and Stoch RSI is lifting from the lower zone, signaling potential continuation momentum if volume confirms.
Scalp Plan:
* Bullish Entry: Above $308, target $311.5 → $314, stop below $305.5
* Bearish Scenario: Failure to hold $305 with volume; target $299 → $295, stop above $308.5
Momentum traders should monitor the intraday EMA alignment — a bullish cross and retest setup here could set up a strong Friday run.
📈 4. GEX (Gamma Exposure) Chart – Dealer Positioning (“The Fuel”)
Option flow and gamma positioning support the bullish structure. The highest positive GEX and call resistance cluster sits near $312–$322, matching the same upper technical resistance seen on the charts. The HVL zone at $306–$307 aligns perfectly with the current price — a magnetic gamma pivot area that dealers will likely defend into expiration.
* Positive Gamma: $312 → $322 (call side, upside cap until squeeze)
* Put Support: $295 → $290 (negative gamma pocket, volatility risk if lost)
* IVR: 67.4
* IVx avg: 67.1
* Call Bias: 31.4%
Dealer positioning indicates controlled gamma above $306, but once $311–$314 is breached, hedging could flip bullish — setting up a clean gamma squeeze into $320+.
🎯 Final Outlook
Friday’s tone for ORCL favors continuation as long as $305 holds as intraday demand. A reclaim of $311+ could trigger fast upside momentum into $314–$322, especially if SPY or QQQ maintain strength into the session. Failure to defend $305, however, would open a retest of $299 — the key line in the sand for bulls.
I’m watching for a morning liquidity sweep under $305 followed by a reclaim as the ideal entry trigger. If that happens with MACD confirmation and rising volume, this could be a textbook Friday continuation play.
Disclaimer: This analysis is for educational purposes only and not financial advice. Always do your own research and trade responsibly.
Disclaimer
The information and publications are not meant to be, and do not constitute, financial, investment, trading, or other types of advice or recommendations supplied or endorsed by TradingView. Read more in the Terms of Use.
Disclaimer
The information and publications are not meant to be, and do not constitute, financial, investment, trading, or other types of advice or recommendations supplied or endorsed by TradingView. Read more in the Terms of Use.