Analysis:
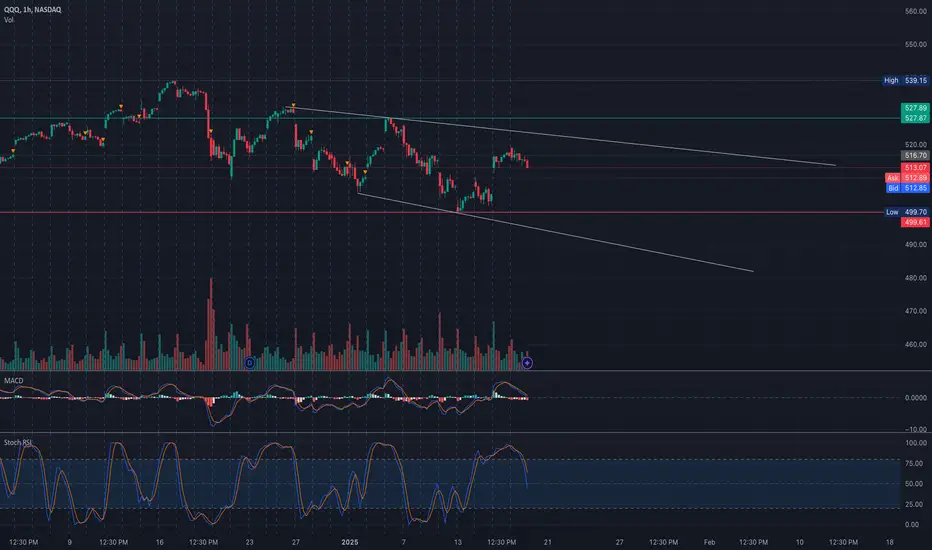
QQQ has been trending downward within a descending channel, currently trading near the $512-$513 level. This range aligns with key GEX resistance and put support, indicating a balance between buyers and sellers. The MACD is bearish, showing downward momentum, while the Stochastic RSI suggests the potential for a relief bounce as it approaches oversold conditions.
Volume indicates indecision, with sellers maintaining control but showing some hesitation near the $510-$513 zone.
Key Levels to Watch:
* Resistance Levels:
* $516-$518: Immediate resistance, aligning with GEX call walls.
* $520-$522: Critical resistance with strong gamma positioning and call walls.
* Support Levels:
* $513: First support level.
* $511-$512: Key support with significant negative GEX positioning.
* $508: Extended downside support within the channel.
GEX Insights:

* Gamma Exposure (GEX):
* Positive GEX peaks near $520-$522, indicating strong overhead resistance.
* Negative GEX at $511-$512 provides a key support zone but signals potential volatility if breached.
* Options Activity:
* IVR: Low at 16.2, suggesting reduced implied volatility.
* Put/Call Bias: Puts dominate at 25.1%, showing bearish sentiment.
Trade Scenarios:
Bullish Scenario:
* Entry: Break above $516 with volume confirmation.
* Target: $520 (first target), $522 (extended target).
* Stop-Loss: Below $513.
Bearish Scenario:
* Entry: Break below $511 with increasing selling pressure.
* Target: $508 (first target), $505 (extended target).
* Stop-Loss: Above $514.
Directional Bias:
The bias is cautiously bearish as QQQ continues to trade within the descending channel. However, a break above $516 could signal a short-term relief rally.
Actionable Suggestions:
* For Scalpers: Focus on the $511-$516 range for quick trades in either direction.
* For Swing Traders: Monitor key levels around $508-$522 for breakout or breakdown opportunities.
Disclaimer: This analysis is for educational purposes only and does not constitute financial advice. Always do your own research and manage your risk before trading.
QQQ has been trending downward within a descending channel, currently trading near the $512-$513 level. This range aligns with key GEX resistance and put support, indicating a balance between buyers and sellers. The MACD is bearish, showing downward momentum, while the Stochastic RSI suggests the potential for a relief bounce as it approaches oversold conditions.
Volume indicates indecision, with sellers maintaining control but showing some hesitation near the $510-$513 zone.
Key Levels to Watch:
* Resistance Levels:
* $516-$518: Immediate resistance, aligning with GEX call walls.
* $520-$522: Critical resistance with strong gamma positioning and call walls.
* Support Levels:
* $513: First support level.
* $511-$512: Key support with significant negative GEX positioning.
* $508: Extended downside support within the channel.
GEX Insights:
* Gamma Exposure (GEX):
* Positive GEX peaks near $520-$522, indicating strong overhead resistance.
* Negative GEX at $511-$512 provides a key support zone but signals potential volatility if breached.
* Options Activity:
* IVR: Low at 16.2, suggesting reduced implied volatility.
* Put/Call Bias: Puts dominate at 25.1%, showing bearish sentiment.
Trade Scenarios:
Bullish Scenario:
* Entry: Break above $516 with volume confirmation.
* Target: $520 (first target), $522 (extended target).
* Stop-Loss: Below $513.
Bearish Scenario:
* Entry: Break below $511 with increasing selling pressure.
* Target: $508 (first target), $505 (extended target).
* Stop-Loss: Above $514.
Directional Bias:
The bias is cautiously bearish as QQQ continues to trade within the descending channel. However, a break above $516 could signal a short-term relief rally.
Actionable Suggestions:
* For Scalpers: Focus on the $511-$516 range for quick trades in either direction.
* For Swing Traders: Monitor key levels around $508-$522 for breakout or breakdown opportunities.
Disclaimer: This analysis is for educational purposes only and does not constitute financial advice. Always do your own research and manage your risk before trading.
Disclaimer
The information and publications are not meant to be, and do not constitute, financial, investment, trading, or other types of advice or recommendations supplied or endorsed by TradingView. Read more in the Terms of Use.
Disclaimer
The information and publications are not meant to be, and do not constitute, financial, investment, trading, or other types of advice or recommendations supplied or endorsed by TradingView. Read more in the Terms of Use.