📊 QUESS CORP LTD – Weekly Chart Analysis
🕰️ Timeframe: 1W | 📈 Pattern: Cup & Handle Formation
🔍 Chart Overview:
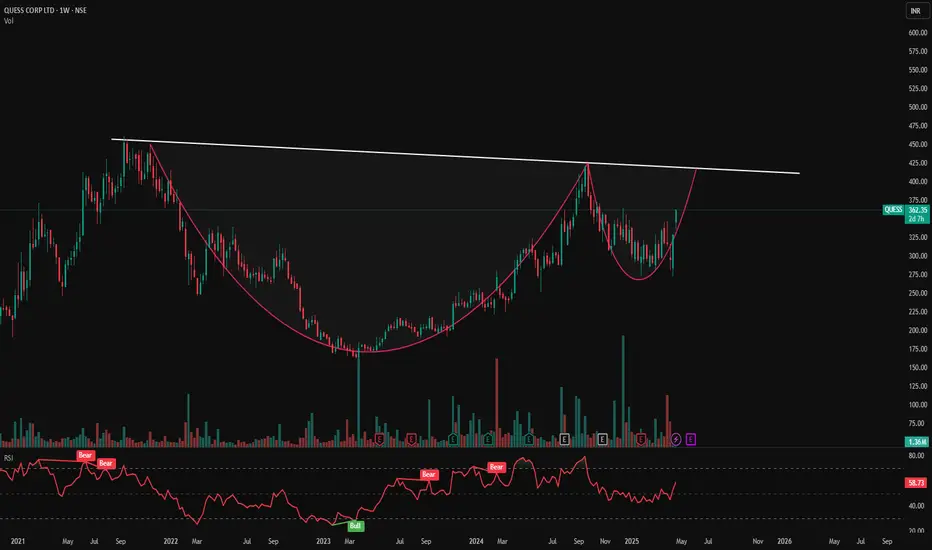
QUESS is exhibiting a classic multi-year Cup & Handle pattern, forming over 3 years — a powerful technical setup indicating potential bullish continuation.
Currently, price is approaching a crucial descending trendline resistance that has been respected multiple times. A breakout above this level with volume confirmation could signal a major upside.
🔑 Key Technical Highlights:
📉 Trendline Resistance: Near ₹420
🟢 Immediate Resistance Zone: ₹390–₹420
🛑 Support Zone: ₹325–₹300
🔁 Breakout Watch: Close above ₹420 (weekly) with volume = bullish confirmation
📊 Volume & Momentum:
Increasing volume on recent up moves
RSI trending upward (if included, add RSI screenshot or note over 60+)
🧠 Bias: Bullish (on breakout confirmation)
🔔 What to Watch:
🔓 Breakout above ₹420 = trigger for swing/mid-term entries
📉 Breakdown below ₹325 may invalidate pattern
⚠️ Disclaimer: This is not financial advice. Chart shared for educational purposes only. Do your own research before investing.
📌 Follow for more chart setups | PriceAction_Pulse
💬 Drop your views or questions in comments!
🕰️ Timeframe: 1W | 📈 Pattern: Cup & Handle Formation
🔍 Chart Overview:
QUESS is exhibiting a classic multi-year Cup & Handle pattern, forming over 3 years — a powerful technical setup indicating potential bullish continuation.
Currently, price is approaching a crucial descending trendline resistance that has been respected multiple times. A breakout above this level with volume confirmation could signal a major upside.
🔑 Key Technical Highlights:
📉 Trendline Resistance: Near ₹420
🟢 Immediate Resistance Zone: ₹390–₹420
🛑 Support Zone: ₹325–₹300
🔁 Breakout Watch: Close above ₹420 (weekly) with volume = bullish confirmation
📊 Volume & Momentum:
Increasing volume on recent up moves
RSI trending upward (if included, add RSI screenshot or note over 60+)
🧠 Bias: Bullish (on breakout confirmation)
🔔 What to Watch:
🔓 Breakout above ₹420 = trigger for swing/mid-term entries
📉 Breakdown below ₹325 may invalidate pattern
⚠️ Disclaimer: This is not financial advice. Chart shared for educational purposes only. Do your own research before investing.
📌 Follow for more chart setups | PriceAction_Pulse
💬 Drop your views or questions in comments!
Disclaimer
The information and publications are not meant to be, and do not constitute, financial, investment, trading, or other types of advice or recommendations supplied or endorsed by TradingView. Read more in the Terms of Use.
Disclaimer
The information and publications are not meant to be, and do not constitute, financial, investment, trading, or other types of advice or recommendations supplied or endorsed by TradingView. Read more in the Terms of Use.