🔍 Current basics
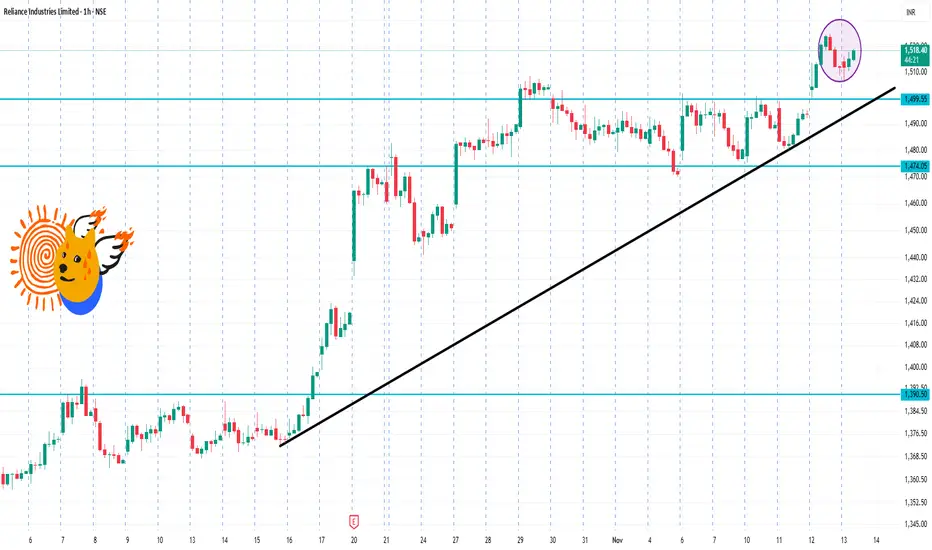
Latest traded price: ~ ₹1,518 on NSE.
52-week range: Low ~ ₹1,114.85, High ~ ₹1,551.00.
Technical indicator summary (on 1-hour/higher timeframes) shows a “Strong Buy” bias.
⚠️ Risks / Caveats
Even though the technicals are bullish, the stock is close to its 52-week high (~ ₹1,551). Highs often mean less “room” for upside without some pullback.
Intraday patterns can change quickly with macro news or sector moves (eg: oil & gas, regulatory).
Support at ~₹1,500 is fairly close to current; a break could expose the ₹1,470–₹1,480 region.
Because this is a large-cap and widely held stock, institutional moves and volume matter a lot.
Related publications
Disclaimer
The information and publications are not meant to be, and do not constitute, financial, investment, trading, or other types of advice or recommendations supplied or endorsed by TradingView. Read more in the Terms of Use.
Related publications
Disclaimer
The information and publications are not meant to be, and do not constitute, financial, investment, trading, or other types of advice or recommendations supplied or endorsed by TradingView. Read more in the Terms of Use.