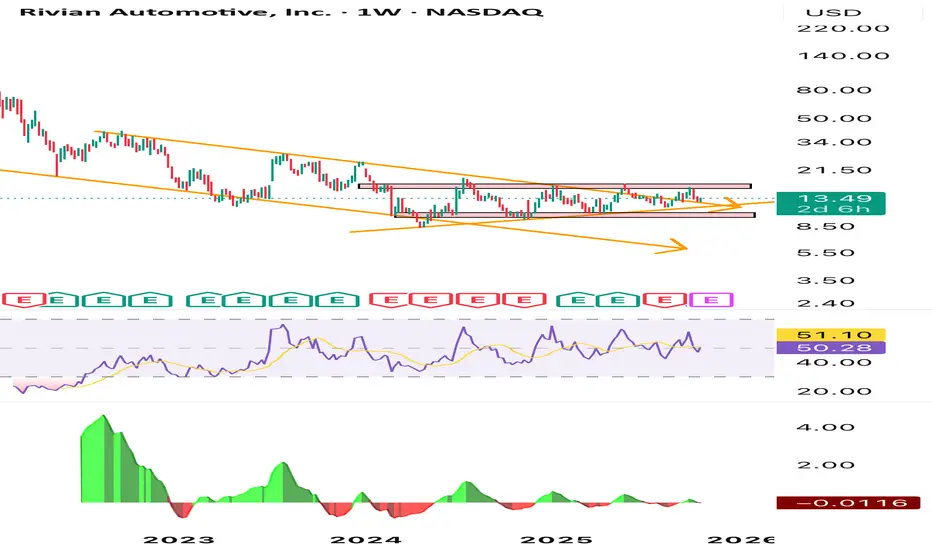
You’ve clearly identified a descending channel (orange lines) that has contained the stock’s downtrend since its IPO highs. Over time, Rivian’s price compressed into a symmetrical triangle or horizontal range between roughly $10–$16, signaling a classic “consolidation before decision” phase.
• Support: Around $10–11, repeatedly tested and held — forming a potential accumulation base.
• Resistance: Around $16, rejecting multiple breakout attempts.
• Trendlines: The upper descending trendline (orange) has been tested enough times to lose some strength — a breakout above $16–17 would likely trigger a technical rally.
If it breaks above $16 with volume, you might see a measured move target around $22–24, aligning with prior resistance levels.
If it breaks below $11.6, it could revisit $6–7, completing the larger descending channel pattern.
Institutional sentiment tends to cycle around major news catalysts (earnings, delivery updates, or cost-cutting milestones). The long sideways movement may suggest institutional accumulation, waiting for a macro tailwind (e.g., lower rates or positive EV policy incentives).
Disclaimer
The information and publications are not meant to be, and do not constitute, financial, investment, trading, or other types of advice or recommendations supplied or endorsed by TradingView. Read more in the Terms of Use.
Disclaimer
The information and publications are not meant to be, and do not constitute, financial, investment, trading, or other types of advice or recommendations supplied or endorsed by TradingView. Read more in the Terms of Use.