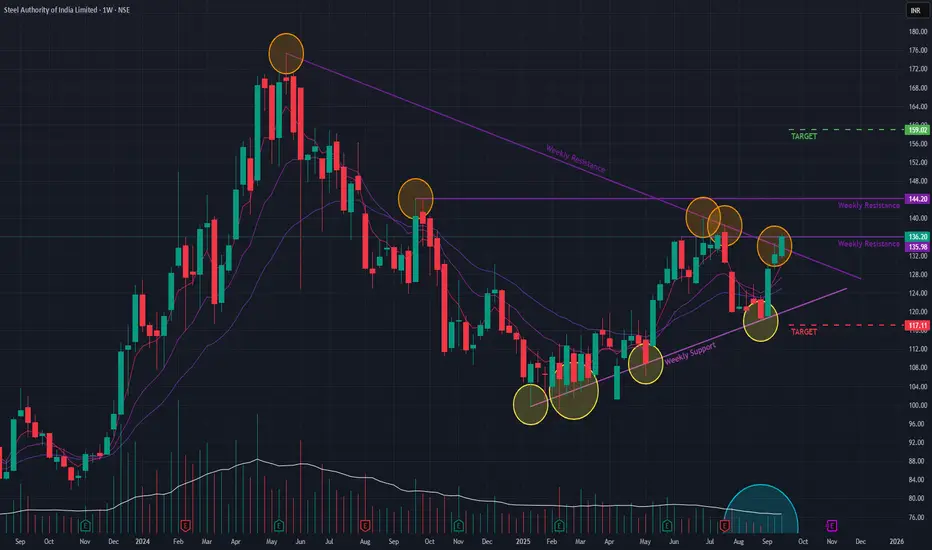
SAIL is showing signs of a potential turnaround after a prolonged downtrend that began in May 2024. This week, the stock executed a significant breakout from a long-term angular resistance trendline, a move accompanied by a healthy increase in volume and a price surge of +2.98%.
This bullish development follows a period of consolidation that began after the downtrend reversed in January 2025. The stock is now testing a key short-term resistance level.
Bullish Indicators to Note 👍
The positive outlook is supported by the following technical signals:
- Breakout Confirmation: The move through the long-term trendline was validated by a notable increase in trading volume, indicating strong buyer participation.
- Momentum: Short-term Exponential Moving Averages (EMAs) are in a positive crossover, signaling building upward momentum.
Immediate Hurdles Ahead 🚧
Despite the positive momentum, a sustained rally depends on the stock's ability to overcome two significant upcoming resistance levels. The price action in the upcoming week will be crucial to watch for confirmation of the breakout's strength.
Future Outlook and Key Levels
- Bullish Case 📈: If the stock successfully breaks through the immediate resistances and the upward momentum continues, the next potential price target is ₹159.
- Bearish Case 📉: However, if the stock fails to clear these hurdles and momentum wanes, a pullback towards the support level of ₹117 is possible.
Disclaimer: This analysis is my personal view & for educational purposes only. They shall not be construed as trade or investment advice. Before making any financial decision, it is imperative that you consult with a qualified financial professional.
Disclaimer
The information and publications are not meant to be, and do not constitute, financial, investment, trading, or other types of advice or recommendations supplied or endorsed by TradingView. Read more in the Terms of Use.