📊 SBICARD Trade Analysis
🔎 Price Action
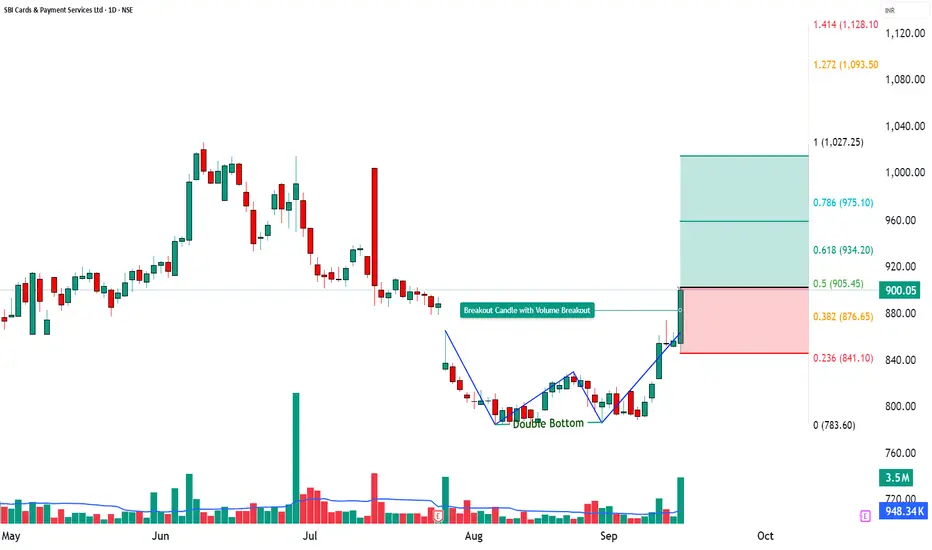
SBICARD closed at ₹900.05 with a sharp +5.13% gain, backed by a volume of 35.03 lakh, far higher than its 20-day average of 9.48 lakh (VolX = 3.67x).
This massive surge in activity highlights aggressive buying and momentum revival after a consolidation phase.
________________________________________
📉 Chart Signals – Double Bottom Pattern Breakout
Strong bullish candle with heavy volumes.
RSI breakout + CCI strength confirming trend.
Bollinger Band breakout → signals upside continuation.
________________________________________
📍 Key Levels
Resistance: 919 – 938 – 974
Support: 863 – 827 – 808
________________________________________
📈 Investment Outlook
📈 Bullish Case – Why the stock could go up
High-volume breakout (VolX = 3.67x) signals strong participation.
Momentum indicators (RSI 74, CCI 238, Stochastic 98) confirm overbought strength.
Upside potential toward ₹959 – ₹1015 if buying sustains.
📉 Bearish Case – Potential downside risks
Failure to hold above ₹902 could lead to profit booking.
High RSI suggests short-term overbought → risk of pullback.
A break below ₹863 may drag toward ₹827 – ₹808.
⚡ Momentum Case – Short-term Trading Edge
Volume breakout + RSI strength highlight bullish edge.
Bollinger Band breakout points to strong near-term volatility.
Holding above ₹902–919 may fuel rally toward ₹958–₹1015.
📅 Short-term vs Long-term Perspective
Short-term (1–2 weeks): Likely to test resistances 919–974; supports 863–827 remain key.
Long-term (1–3 months): Stock in recovery phase; sustained volumes and trend strength could establish higher base above ₹900.
________________________________________
📝 STWP Trade Analysis
Outlook: Momentum: Moderate, Trend: Neutral
Entry: 902 | Stop-loss: 845.32
Target-1: 958.68 | Target-2: 1015.36
Risk/Reward: 1:6.08 | Risk: High | Volume: High
Demand Zone: 874 – 850.05 | SL: 848.95(Pullback Zone)
Learning Note: SBICARD is showing momentum revival with strong volumes; watch for sustainability above ₹900 to confirm trend continuation.
________________________________________
⚠️ Disclaimer – Please Read Carefully
The information shared here is meant purely for learning and awareness. It is not a buy or sell recommendation and should not be taken as investment advice. I am not a SEBI-registered investment advisor, and all views expressed are based on personal study, chart patterns, and publicly available market data.
Trading — whether in stocks or options — carries risk. Markets can move unexpectedly, and losses can sometimes exceed the money you have invested. Past performance or past setups do not guarantee future results.
If you are a beginner, treat this as a guide to understand how the market works — practice on paper trades before risking real money. If you are experienced, always assess your own risk, position sizing, and strategy suitability before entering trades.
Consult a SEBI-registered financial advisor before making any real trading decision. By engaging with this content, you acknowledge full responsibility for your trades and investments.
💬 Found this useful?
🔼 Give this post a Boost to help more traders discover clean, structured learning.
✍️ Drop your thoughts, questions, or setups in the comments — let’s grow together!
🔁 Share with fellow traders and beginners to spread awareness.
👉 “If you liked this breakdown, follow for more clean, structured setups with discipline at the core.”
🚀 Stay Calm. Stay Clean. Trade With Patience.
Trade Smart | Learn Zones | Be Self-Reliant 📊
🔎 Price Action
SBICARD closed at ₹900.05 with a sharp +5.13% gain, backed by a volume of 35.03 lakh, far higher than its 20-day average of 9.48 lakh (VolX = 3.67x).
This massive surge in activity highlights aggressive buying and momentum revival after a consolidation phase.
________________________________________
📉 Chart Signals – Double Bottom Pattern Breakout
Strong bullish candle with heavy volumes.
RSI breakout + CCI strength confirming trend.
Bollinger Band breakout → signals upside continuation.
________________________________________
📍 Key Levels
Resistance: 919 – 938 – 974
Support: 863 – 827 – 808
________________________________________
📈 Investment Outlook
📈 Bullish Case – Why the stock could go up
High-volume breakout (VolX = 3.67x) signals strong participation.
Momentum indicators (RSI 74, CCI 238, Stochastic 98) confirm overbought strength.
Upside potential toward ₹959 – ₹1015 if buying sustains.
📉 Bearish Case – Potential downside risks
Failure to hold above ₹902 could lead to profit booking.
High RSI suggests short-term overbought → risk of pullback.
A break below ₹863 may drag toward ₹827 – ₹808.
⚡ Momentum Case – Short-term Trading Edge
Volume breakout + RSI strength highlight bullish edge.
Bollinger Band breakout points to strong near-term volatility.
Holding above ₹902–919 may fuel rally toward ₹958–₹1015.
📅 Short-term vs Long-term Perspective
Short-term (1–2 weeks): Likely to test resistances 919–974; supports 863–827 remain key.
Long-term (1–3 months): Stock in recovery phase; sustained volumes and trend strength could establish higher base above ₹900.
________________________________________
📝 STWP Trade Analysis
Outlook: Momentum: Moderate, Trend: Neutral
Entry: 902 | Stop-loss: 845.32
Target-1: 958.68 | Target-2: 1015.36
Risk/Reward: 1:6.08 | Risk: High | Volume: High
Demand Zone: 874 – 850.05 | SL: 848.95(Pullback Zone)
Learning Note: SBICARD is showing momentum revival with strong volumes; watch for sustainability above ₹900 to confirm trend continuation.
________________________________________
⚠️ Disclaimer – Please Read Carefully
The information shared here is meant purely for learning and awareness. It is not a buy or sell recommendation and should not be taken as investment advice. I am not a SEBI-registered investment advisor, and all views expressed are based on personal study, chart patterns, and publicly available market data.
Trading — whether in stocks or options — carries risk. Markets can move unexpectedly, and losses can sometimes exceed the money you have invested. Past performance or past setups do not guarantee future results.
If you are a beginner, treat this as a guide to understand how the market works — practice on paper trades before risking real money. If you are experienced, always assess your own risk, position sizing, and strategy suitability before entering trades.
Consult a SEBI-registered financial advisor before making any real trading decision. By engaging with this content, you acknowledge full responsibility for your trades and investments.
💬 Found this useful?
🔼 Give this post a Boost to help more traders discover clean, structured learning.
✍️ Drop your thoughts, questions, or setups in the comments — let’s grow together!
🔁 Share with fellow traders and beginners to spread awareness.
👉 “If you liked this breakdown, follow for more clean, structured setups with discipline at the core.”
🚀 Stay Calm. Stay Clean. Trade With Patience.
Trade Smart | Learn Zones | Be Self-Reliant 📊
STWP | Mentor & Demand-Supply Specialist | Empowering traders through structured learning |
simpletradewithpatience.com
Community: chat.whatsapp.com/BEYz0tkqP0fJPBCWf59uel
wa.me/message/6IOPHGOXMGZ4N1
Educational Only
simpletradewithpatience.com
Community: chat.whatsapp.com/BEYz0tkqP0fJPBCWf59uel
wa.me/message/6IOPHGOXMGZ4N1
Educational Only
Disclaimer
The information and publications are not meant to be, and do not constitute, financial, investment, trading, or other types of advice or recommendations supplied or endorsed by TradingView. Read more in the Terms of Use.