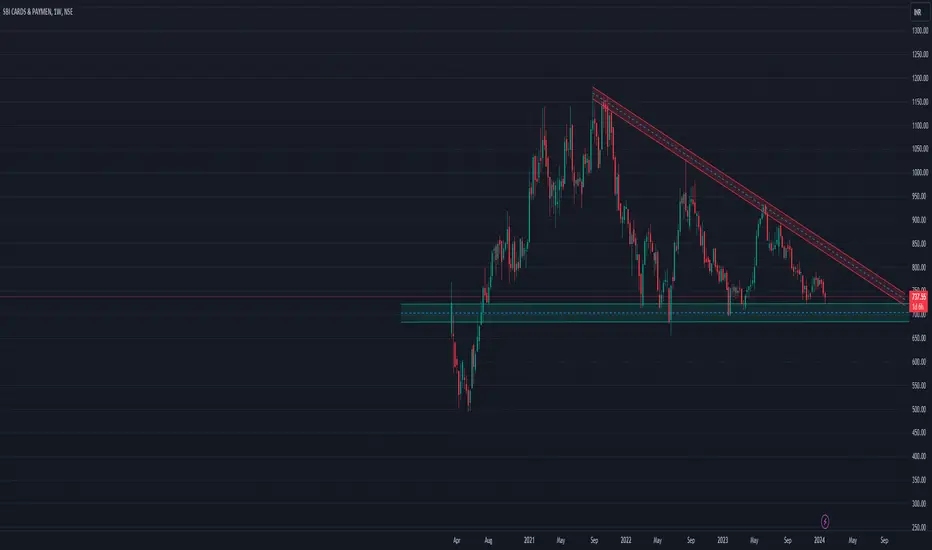
SBI CARDS & PAY SER LTD looks at bottom, Ready to change trendHello, Everyone I hope you all will be doing well in your life and your investing as well. Here I have brought a stock that looks at bottom and ready to change trend. SBI Cards & Payment Services Ltd is the name of the stock. CMP is 712. Its all time low is 495 and all time high is 1160. Strong support at 680. It made low 655 in June 22, low of 678 in march 24, low of 647 in June 24, low 659 in Oct 24 and 670 in Nov 24. But not closing below that. Upside target as per Fibbo 790, 850, 900, 950, 1040, 1150. Just an assumption. Please do you research. Not a suggestion of buying.
Source: Screener.in
SBI Cards & Payment Services Ltd
About
SBI Cards and Payment Services Limited is a non-deposit accepting systemically important nonbanking financial company registered with the RBI. The Company is engaged in issuing credit cards to consumers in India. It is headquartered in Gurgaon, Haryana. It is a subsidiary of India’s largest commercial bank, the State Bank of India.
Key Points
History
SBI Card was launched in 1998 by the State Bank of India and GE Capital. In December 2017, State Bank of India and The Carlyle Group acquired GE Capital`s stake in SBI Card.In March 2020, SBI Card became the first pure play credit card company to list on the stock exchanges in India.
Largest Credit Card Company
SBI Card, a subsidiary of the State Bank of India, is the largest pure-play credit card issuer in India.
Products
The company offers 3 types of cards: Super Premium (1 card), Core Cards ( 8 cards), and Co-Brand Cards (15 Cards in association with banks, retail and travel partners).
Market Share
Card in Force- 18.9% till Dec 23 compared to 19.1% in FY21
Spends- 18.3% till Dec 23 compared to 19.4% in FY21
Transaction- 17.1% till Dec 23 compared to 19.7% in FY21
Cards in forces stood at 1.85 Cr as on Dec 23 compared to 1.59 Cr as on Dec 22.
Revenue breakup Q3 FY24
Interest Income: 45% (vs 44% Q4 FY22)
Spend based: 29% (vs 26% Q4 FY22)
Subscription-based: 6% (vs 8% Q4 FY22)
Instance-based and others: 20% (vs 22% Q4 FY22)
NPA
Gross NPA: 2.64% in Q3FY24 (Increase 43 bps YoY)
Net NPA: 0.96% in Q3FY24 (Increase 16 bps YoY)
Borrowing Mix
The Co’s funds have diversified sources including Working Capital Demand Loan (69%), Debentures (12%), and Term loan (19%). The share of term loan has increased from 3% while share of NCD dropped from 30% since Dec 23.
New Cards Launches
SBI Cards recently partnered with Reliance Retail to launch Reliance SBI Card focused on lifestyle.
During FY23, the company launched Cashback SBI Card for cashback on all online spend, Aditya Birla SBI Card in partnership with Aditya Birla Finance Ltd for brands under Aditya Birla Group and PSB SBI Card partnered with Punjab & Sind Bank for premium segment.
Changes in KMP
Ahijit Chakravorty took charge as MD & CEO as Mr. Rama Mohan Rao Amara former MD & CEO resigned due to his transfer back to the State Bank of India on August 11, 2023.
Focus
Company will focus on acquiring cards across the diversified sourcing channels which includes open market and SBI customer base across both traditional point of sale as well as digital channels. It aims to increase its digital sourcing and has launched SBI Card SPRINT, an end-to-end digital application process for customers.
This is just to boost my confidence. No Suggestions for buying.
Disclosure: I am not SEBI registered. The information provided here is for educational purposes only. I will not be responsible for any of your profit/loss with these suggestions. Consult your financial advisor before making any decisions.
Sbicards

SBI CARD#SBICARD
stock holds abv the resistance
looking good for buying
weak below 690
upside targets 715-730

Charging it up with SBI Cards - Observation only- NOT FINANCIAL ADVICE -
Simple funda - Best exposure to pure credit card growth in India, through a subsidiary of India's largest bank. A quasi state owned credit card company.
Breakout above previous support (and now resistance) in price along with a close above 325 day SMA will make it a buy - all levels given on charts

SBICARD Looks good...SBICARD looks good for reversal in weekly chart.
Can Accumulate between 700-750 zone. Might reach channel upper line in coming years. Targets are given.
Stoploss for longtermInvestors is given.
Note : No idea about fundamentals. View is completely based on technical view of chart.

SBI CARDS - Not Bullish Yet | Neglected Stock!Price Analysis & Overview:
1. Price are yet to form HH-HL formations.
2. Trading below 50 EMA.
3. Volumes are dry. It seems like no one is still interested in the stock!
4. Touched the demand multiple times - increasing the chances to break the zone and go further lower.
5. Forming Double bottom.
6. Earnings are strong - That's the only good thing in the stock currently.
Trading Plan:
- JUST OBSERVE.
- Let it prove the buying strength!
Monthly TF View:
- Stay tuned for further insights, updates and trade safely!
- These are my personal views.
- If you liked the analysis, don't forget to leave a comment and boost the post. Happy trading!
Disclaimer: This is NOT a buy/sell recommendation. This post is meant for learning purposes only. Please, do your due diligence before investing.
Thanks & Regards,
Anubrata Ray

SBI CARDS TRADING AT IT'S WEEKLY SUPPORTIn SBI CARDS, 650-700 is a huge demand zone in weekly timeframe. This is the level of value buying for big institutions. SBI CARDS will change it's weekly structure above 800 which can be considered as a safe entry point for conservative investors. For aggressive buying, we need to look for structure change in a shorter timeframe, may be hourly.
Targets for mid to long term have been calculated according to the swing highs in weekly timeframe.
This whole idea will become invalid if price closes below 655 which is the major support area in weekly timeframe.
So, please keep SBI CARDS in your watchlist for long term investment.
If you like my view, do support it with a boost which is a valuable inspiration for me to post ideas like this in future. Thank you friends!

SBI CARD BULLISH
SBI CARD is now available to us at very low price.
It broke a major support line and broke out failure.
A channel pattern is farmed as it descends.
This is a very strong demand zone where institutional players and big players are likely to enter.
If a daily candle closes above 710 we can look bullish from here.
First target@770
Second target@880
Stop loss@678
So please keep SBI CARDS in your watchlist for long term investment.
If yoy like my view, do support it with a boost whitch is valuable inspiration for me to post ideas like this in future. thank you friends!
Disclaimer:
I am not a SEBI Registered Analyst. Anything posted here is my own analysis and views. This is created for educational purposes only. Always consult your Financial Advisor before taking any decision or trade.
Happy trading.

SBICARD breakout from resistance level
trading below 200 moving average
relative strength line below zero line
which are not good symbol
can take a trade with stop loss of 670
which is 8% loss

SBI card trading close to a support zoneSBI Card is trading very close to a support zone on weekly charts. What do you think? We will see a reversal from here or a breakdown?
Note : For educational and informational purpose only. We do not provide any buy or sell recommendations as we are not a SEBI registered Research Analyst .
SBI Cards & Payments Services: 50% upmove possible➡️Trading near major trading area
➡️Highest ever sales & EPS (TTM)
➡️I expect the increased risk weights on loans will filter riskier customers and reduce NPA
➡️near the Lowest ever PE since listing
➡️will add 50% near 700

SBI CardSupport trendline breakdown in SBI Card on weekly chart. But this looks like a fake breakdown. Confirmation will come around 890.
Disclaimer: Not SEBI registered. Showing analysis for educational purpose only. Consult a SEBI registered research analyst before taking any buy or sell decision.

Positional_ SBI Cards1. SBI Card has formed Cup and Handle Pattern.
2. I am expecting a breakout again after a RETEST.
3. SL, Entry and Target to be posted afterwards.
Disclaimer: The views expressed in this article is of my own and you're solely responsible for any decision taken in the markets resulting in financial gains or losses. The analysis I've shared is just for informational and educational purposes. I already have open positions which will be squared-off after target is met.

SBI Cards; Bullish viewGot these shares in the IPO; added some more at Rs 515
Now the share has retested it's weekly support (which was pending). I am expecting a great journey on the long side (of course it'll take time).
New entry not suggested; "Hold" for the person already have this. I promised myself that I won't exit this stock until and unless my money is "doubled".
Fundamentally it looks attractive:
1. Reduction in competition: HDFC bank being restricted to issue new credit cards
2. It is 2nd Largest issuer of credit cards in India
3. 41% CAGR for previous 4 years in PBT (Profit Before Tax)
I've shared my view, but please do your own analysis.

Small Rounding Bottom More UpsideHii all...
Greetings!
Today sharing with you SBICARDS daily basis charts, a small rounding bottom pattern can been seen around 822 to 865 levels, pattern shows a bullish view from current levels.
Thanking You
Important Things
1. This is only for educational purposes only.
2. Never over trade.
3. Always keep Stop Loss.
4. Trade in limited quantity.
5. Taking a small loss is better than wiping up your whole capital.
I hope you found this idea helpful.
Please like and comment.
Share with Your Friends.
Keep Learning,
Happy & Safe Trading
Disclaimer – These ideas shared by me to all are my personal analysis / views. Im not a SEBI registered technical analysis.

SBI Cards long at Support trendlineSBI Cards is bouncing from it's multiyear support trendline, also a small triangle formation in making. Possbile long trade here

Is SBI Card ready for the next strong upside ??NSE:SBICARD is performing better and better when we checkout the results. The script is fundamentally sound and the card business is on track. Investors can add positions at current levels i.e Rs. 715. A strong upmove or rebound expected in near term.
Targets:
Short Term: 775
Long Term: 900
QoQ Results were good
Script Available at lows
Growth and expansion in this business is huge
The idea shared is only for Educational Purpose.

SBI Card On Weekly Demand Zone New Study For Paper Trade
Buy SBI Card Near 770-780 (add more at 755-765)
StopLoss :740
Target : 840-900-970
Currently Sbi card is consolidated in one range and also box Pattern applied when box Pattern Break then perfect entry caught.
You can Also buy futures and call option after trend reversal confirmation.
Study Logic
👉 Weekly Demand Zone
Only For Paper Trade And Education Purpose
Don't Real Trade
I am not sebi Registered Here Post is only for Education purpose i am not responsible for any profit and loss.


SBI Cards LongSBICARDS crossed 50SMA & 20SMA with a wedge pattern breakout on Hourly timeframe
Enter long trade above 804
SL- 795
T- 816

sbicards EXamplesbicard perfect dragon pattern
for long term
techically analysis only
currently formed diamond pattern or side ways

SBI Card - Looks good for new All Time Highs soon... SBI Card is looking good for very attractive upmove at CMP in days coming which may take it to 1400+
SL 740/-

SBI CARDS BREAKOUT Sbi cards looks good on weekly charts given breakout on strong horizontal resistance trendline and gives a strong close above Bollinger upper band both breakout indicating good up move coming this stock
CAUSE OF LONG-:
1- Breakout on horizontal resistance trendline
2- Breakout on upper Bollinger band

SBI Card: A good portfolio betSBI Cards is trading at 49PE. A good portfolio bet for 1300+ TGTs in a yearly time frame.
