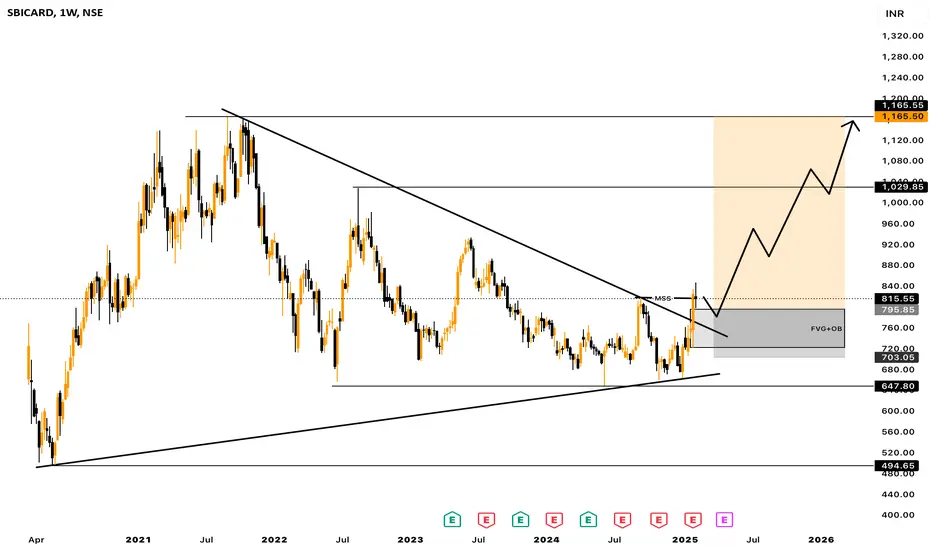
• The weekly chart of SBI Cards (SBICARD) shows a symmetrical triangle pattern that has been forming since mid-2021.
• The stock recently broke out of this pattern, indicating a potential trend reversal or continuation move depending on broader market conditions.
• Resistance Breakout: The upper trendline, which acted as resistance, has been breached, and the stock is now retesting the breakout level (~800).
• Volume Confirmation Needed: To validate the breakout, an increase in volume would be ideal.
Fundamental Analysis: Mixed Earnings Performance
• Earnings Per Share (EPS) Trends:
• Q3 FY24 EPS came in at 4.25, missing estimates by 31.16%—a significant negative surprise.
• Q2 FY24 EPS also missed estimates by 4.51%, while Q1 FY24 had a 4.59% miss as well.
• The company has shown inconsistent earnings, which could cause volatility despite the technical breakout.
• Revenue Growth:
• Q3 FY24 revenue was ₹46.19B, exceeding estimates by 10.06%.
• Q2 FY24 revenue missed expectations by 3.01%, while Q1 FY24 was also slightly weak.
• This suggests that while top-line growth is strong, profitability (EPS) is under pressure due to either higher costs or operational inefficiencies.
Investment View: Cautious Buy with Risk Management
• Technical View: The breakout above the triangle is bullish, but the stock must sustain above 800-820 for confirmation. If it does, next resistance levels are 900 and 1000.
• Fundamental Concerns: Weak earnings growth is a risk factor. The next earnings (April 2025) will be crucial.
• Buying Strategy:
• Entry: If the stock holds above 800-820, it can be bought with a target of 900-1000.
• Stop Loss: 750-770 zone (below the breakout trendline).
• Risk Factor: If broader market sentiment weakens or earnings disappoint further, the breakout might fail.
Conclusion: A breakout trade is valid, but weak earnings make it a cautious buy with a tight stop loss. If fundamentals improve, the rally could sustain.
Disclaimer
The information and publications are not meant to be, and do not constitute, financial, investment, trading, or other types of advice or recommendations supplied or endorsed by TradingView. Read more in the Terms of Use.
Disclaimer
The information and publications are not meant to be, and do not constitute, financial, investment, trading, or other types of advice or recommendations supplied or endorsed by TradingView. Read more in the Terms of Use.