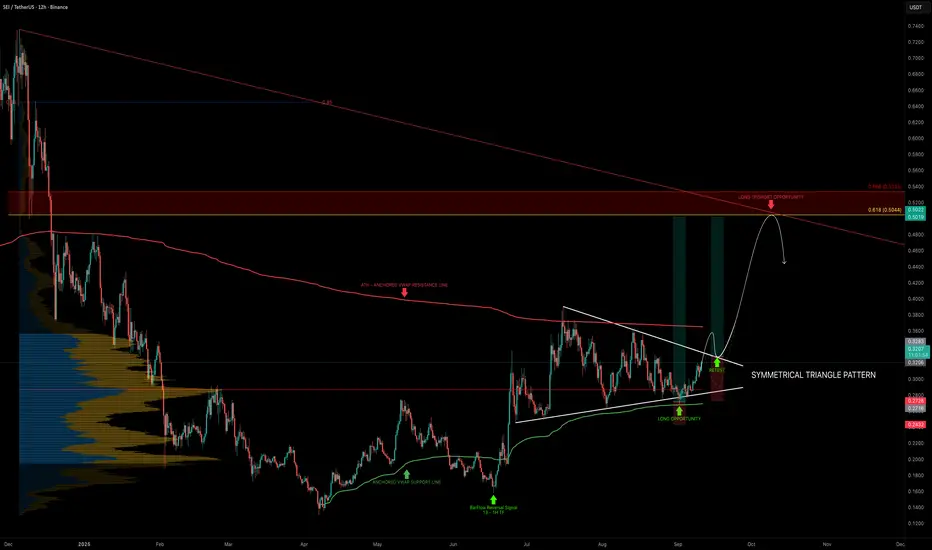
SEI has been consolidating in a symmetrical triangle for the past 78 days, now reaching the apex, signaling that a big move is coming soon.
Price has been trading between two anchored VWAPs:
The POC of the 280-day trading range sits at $0.287, a key pivot level to watch.
Support Confluence
Resistance Confluence
🟢 Long Trade Setup
Technical Insight
_________________________________
💬 If you found this helpful, drop a like and comment!
Price has been trading between two anchored VWAPs:
- From the $0.13 low → acting as support (currently ~$0.27)
- From the ATH → acting as resistance (currently ~$0.365)
The POC of the 280-day trading range sits at $0.287, a key pivot level to watch.
Support Confluence
- Anchored VWAP (from $0.13 low): ~$0.27 (long entry zone already tested)
- POC (280-day range): $0.287 → key stop-loss reference
- Symmetrical triangle breakout retest: ~$0.33 → potential re-entry after breakout
- Fib Speed Resistance Fan 0.618: ~$0.27 → reinforcing support at the anchored VWAP
Resistance Confluence
- 0.618 Fib retracement: $0.5044 → aligns with $0.5 key level
- 3B Market Cap resistance: ~$0.505
- Fair Value Gap (FVG): sitting around $0.5
- Trend-Based Fib Extension 1.0: $0.5 → major target confluence
🟢 Long Trade Setup
- Entry Zone: Retest around $0.33 after breakout
- Stop-Loss: Below $0.287 (POC), to be adjusted after seeing a clear reversal sign.
- Target (TP): $0.50
- Potential Gain: ~+50%
- Timeframe: Could take ~1 month to play out
Technical Insight
- SEI has been compressing for over two months, and volatility is about to expand.
- The ideal entry at $0.27 (anchored VWAP support) has already triggered.
- The next opportunity lies in a triangle breakout + retest around $0.33.
- The $0.50 level stands out as a high-confluence target, combining Fib levels, market cap, FVG, and extension symmetry.
_________________________________
💬 If you found this helpful, drop a like and comment!
Note
SEI Update — Triangle Breakout Retest in PlaySEI has broken out of the symmetrical triangle pattern, following the mapped projection nicely. Price is now approaching the retest zone.
📌 The $0.33–$0.32 zone stands out as a critical support area → I’d like to see a strong bounce from here to confirm continuation.
I’ve included several take-profit (TP) levels in the chart update for clarity.
Note
$0.31 is a reversal point with the most confluence: Note
Golden Pocket Reversal Zone:Note
SEI Update — Reversal at $0.31 Playing OutAs mentioned earlier, $0.31 was the key reversal point with the strongest confluence and it delivered. Price has already pumped +5% from this level.
The 0.666 Fib speed fan acted as a clean support line, further confirming the setup.
Trade closed manually
Closed manually after seeing heavy sellingNote
SEI Update — Testing Range Lows AgainSEI has dropped back to the range lows, retesting the support zone once more. Price is currently trading between the 21 EMA/SMA on the weekly timeframe, a key reversal zone to watch.
On the upside, the 21 EMA/SMA on the monthly timeframe forms a strong resistance cluster between $0.35–$0.40, which will be the zone to reclaim for bullish continuation.
Note
Key level at $0.28 has been broken. Price is now trading below the 21 Weekly EMA/SMA. Next high-probability long setup sits at the FVG:🏆 Mastering Fibonacci for precision trading
🔹 Sharing high-probability trade setups
⚡ Unlock the power of technical analysis!
🔹 Sharing high-probability trade setups
⚡ Unlock the power of technical analysis!
Related publications
Disclaimer
The information and publications are not meant to be, and do not constitute, financial, investment, trading, or other types of advice or recommendations supplied or endorsed by TradingView. Read more in the Terms of Use.
🏆 Mastering Fibonacci for precision trading
🔹 Sharing high-probability trade setups
⚡ Unlock the power of technical analysis!
🔹 Sharing high-probability trade setups
⚡ Unlock the power of technical analysis!
Related publications
Disclaimer
The information and publications are not meant to be, and do not constitute, financial, investment, trading, or other types of advice or recommendations supplied or endorsed by TradingView. Read more in the Terms of Use.