🔹 4H Chart (Swing Bias)
Trend: Clear downtrend with consecutive lower lows inside a red channel.
Recent Move: Price bounced strongly from the 79,800–79,600 demand zone.
FVG: Price is currently reacting to the Fair Value Gap (80,300–80,600).
Resistance: 80,800–81,200 supply + FVG above.
Bias: Temporary relief rally, but macro remains bearish until 81,200 breaks convincingly.
🔹 1H Chart (Intraday Bias)
Structure: Break of structure (BOS) on the upside after strong rejection from 79,800 demand.
Momentum: Short-term bullish push, filling the first FVG around 80,300–80,600.
Liquidity: Buyside liquidity resting near 80,800–81,000 zone.
Bias: Price likely to continue towards 80,800 before facing supply pressure.
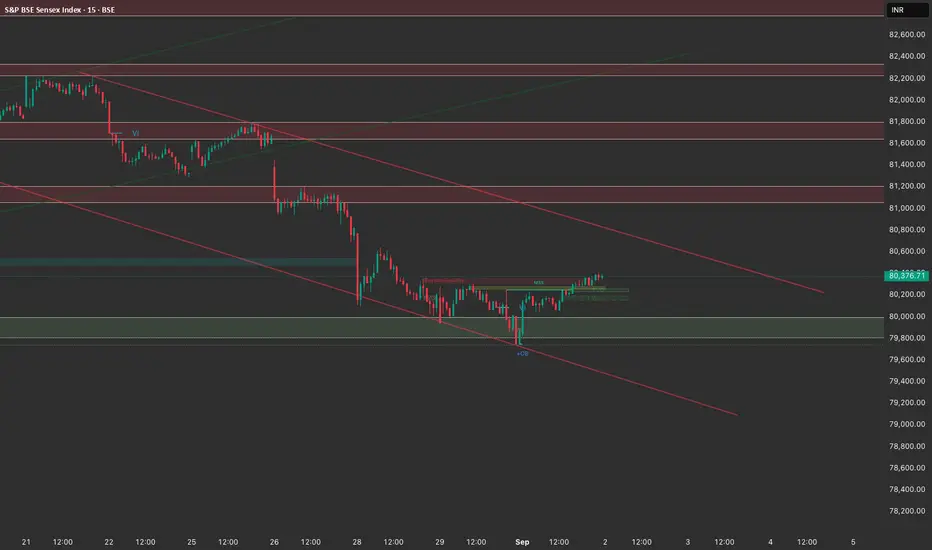
🔹 15M Chart (Execution Bias)
Current Setup: Price is consolidating just above the lower demand (80,200–80,300).
OBs: A bullish OB at 80,100–80,200 could serve as intraday support.
Targets: Immediate target = 80,600; Extended = 80,800.
Stops: Below 79,950 (previous swing low).
📌 Trade Plan for Tomorrow
Primary Bias: Buy on Dips (Intraday Relief Rally)
Entry 1 (Aggressive): 80,200–80,300 retest zone (OB + demand + FVG overlap).
Entry 2 (Conservative): If price sweeps 79,950 and reclaims 80,100 → long setup.
Target 1: 80,600 (FVG fill).
Target 2: 80,800 (liquidity sweep & supply zone).
Stop Loss: Below 79,950 (swing low).
Invalidation: If price closes below 79,800 on 1H → bias flips back bearish, expect 79,400–79,200.
✅ Summary:
Swing bias = Bearish (still inside down channel).
Intraday bias = Bullish relief rally toward 80,800.
Execution = Look for dip buys near 80,200 with SL below 79,950.
Trend: Clear downtrend with consecutive lower lows inside a red channel.
Recent Move: Price bounced strongly from the 79,800–79,600 demand zone.
FVG: Price is currently reacting to the Fair Value Gap (80,300–80,600).
Resistance: 80,800–81,200 supply + FVG above.
Bias: Temporary relief rally, but macro remains bearish until 81,200 breaks convincingly.
🔹 1H Chart (Intraday Bias)
Structure: Break of structure (BOS) on the upside after strong rejection from 79,800 demand.
Momentum: Short-term bullish push, filling the first FVG around 80,300–80,600.
Liquidity: Buyside liquidity resting near 80,800–81,000 zone.
Bias: Price likely to continue towards 80,800 before facing supply pressure.
🔹 15M Chart (Execution Bias)
Current Setup: Price is consolidating just above the lower demand (80,200–80,300).
OBs: A bullish OB at 80,100–80,200 could serve as intraday support.
Targets: Immediate target = 80,600; Extended = 80,800.
Stops: Below 79,950 (previous swing low).
📌 Trade Plan for Tomorrow
Primary Bias: Buy on Dips (Intraday Relief Rally)
Entry 1 (Aggressive): 80,200–80,300 retest zone (OB + demand + FVG overlap).
Entry 2 (Conservative): If price sweeps 79,950 and reclaims 80,100 → long setup.
Target 1: 80,600 (FVG fill).
Target 2: 80,800 (liquidity sweep & supply zone).
Stop Loss: Below 79,950 (swing low).
Invalidation: If price closes below 79,800 on 1H → bias flips back bearish, expect 79,400–79,200.
✅ Summary:
Swing bias = Bearish (still inside down channel).
Intraday bias = Bullish relief rally toward 80,800.
Execution = Look for dip buys near 80,200 with SL below 79,950.
Disclaimer
The information and publications are not meant to be, and do not constitute, financial, investment, trading, or other types of advice or recommendations supplied or endorsed by TradingView. Read more in the Terms of Use.
Disclaimer
The information and publications are not meant to be, and do not constitute, financial, investment, trading, or other types of advice or recommendations supplied or endorsed by TradingView. Read more in the Terms of Use.