Based on the charts and the market's performance on Monday, October 13, the Sensex experienced a sharp pullback from its high, ending its recent winning streak. The current structure is corrective within a larger bullish trend.
Detailed Market Structure Breakdown
4-Hour Chart (Macro Trend)
Structure: The Sensex is still in a bullish recovery phase but has decisively broken below the lower trendline of its very steep short-term ascending channel. The last 4H candle is a bearish candle that breached immediate support levels, confirming the shift to a short-term correction.
Key Levels:
Major Supply (Resistance): 82,300 - 82,500. This area is the critical overhead hurdle (Order Block), which the market was unable to break.
Major Demand (Support): 81,600 - 81,800. This area is the key immediate support, aligning with the major FVG (Fair Value Gap) and the start of the final bullish leg.
Outlook: The short-term bias is sideways-to-bullish. The market is expected to seek support near the 81,600 level.
1-Hour Chart (Intermediate View)
Structure: The 1H chart shows a clear Break of Structure (BOS) to the downside, breaking the lower trendline of the steep ascending channel. The price is now moving within a descending corrective channel.
Key Levels:
Immediate Resistance: 82,150 (Prior consolidation support, now resistance).
Immediate Support: 81,800 (The psychological level and the first major support of the current corrective channel).
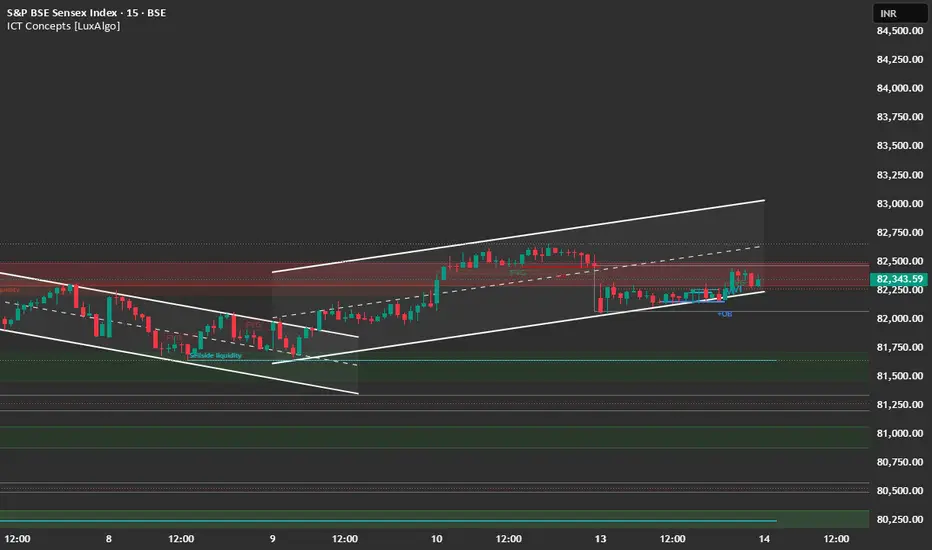
15-Minute Chart (Intraday View)
Structure: The 15M chart confirms the sharp, selling pressure. The market is trading within a descending channel after being rejected from the 82,300 high. The close near the lows indicates bears were in control at the end of the session.
Key Levels:
Intraday Supply: 82,100 (Recent swing high/upper channel boundary).
Intraday Demand: 81,600.
Outlook: Bullish. A "Buy on Dips" strategy is recommended near 82,100.
📈 Trade Plan (Tuesday, 14th October)
Bullish Scenario (Primary Plan)
Justification: Only valid if strong buying emerges to defend the major support and reclaim the entire breakdown structure.
Trigger: A sustained move and close above the resistance at 82,300.
Entry: Long entry on a confirmed 15-minute close above 82,300.
Stop Loss (SL): Below 82,100.
Targets:
T1: 82,500 (Major supply zone).
T2: 82,800 (Extension target).
Bearish Scenario (Counter-Trend/Reversal Plan)
Justification: The breakdown of the steep channel and the heavy rejection from 82,300 favor continuation toward the next major support.
Entry: Short entry on a successful retest and rejection of the 82,000 - 82,100 zone (upper channel resistance). Alternatively, short a decisive break and 15-minute candle close below 81,600.
Stop Loss (SL): Place a stop loss above 82,300 (above the immediate swing high).
Targets:
T1: 81,600 (Major FVG support).
T2: 81,400 (Extension target).
Key Levels for Observation:
Immediate Decision Point: 81,800 - 82,100 zone.
Bearish Confirmation: A break and sustained move below 81,600.
Bullish Confirmation: A move back above 82,300.
Line in the Sand: 81,600. Below this level, the short-term bullish bias is nullified.
Detailed Market Structure Breakdown
4-Hour Chart (Macro Trend)
Structure: The Sensex is still in a bullish recovery phase but has decisively broken below the lower trendline of its very steep short-term ascending channel. The last 4H candle is a bearish candle that breached immediate support levels, confirming the shift to a short-term correction.
Key Levels:
Major Supply (Resistance): 82,300 - 82,500. This area is the critical overhead hurdle (Order Block), which the market was unable to break.
Major Demand (Support): 81,600 - 81,800. This area is the key immediate support, aligning with the major FVG (Fair Value Gap) and the start of the final bullish leg.
Outlook: The short-term bias is sideways-to-bullish. The market is expected to seek support near the 81,600 level.
1-Hour Chart (Intermediate View)
Structure: The 1H chart shows a clear Break of Structure (BOS) to the downside, breaking the lower trendline of the steep ascending channel. The price is now moving within a descending corrective channel.
Key Levels:
Immediate Resistance: 82,150 (Prior consolidation support, now resistance).
Immediate Support: 81,800 (The psychological level and the first major support of the current corrective channel).
15-Minute Chart (Intraday View)
Structure: The 15M chart confirms the sharp, selling pressure. The market is trading within a descending channel after being rejected from the 82,300 high. The close near the lows indicates bears were in control at the end of the session.
Key Levels:
Intraday Supply: 82,100 (Recent swing high/upper channel boundary).
Intraday Demand: 81,600.
Outlook: Bullish. A "Buy on Dips" strategy is recommended near 82,100.
📈 Trade Plan (Tuesday, 14th October)
Bullish Scenario (Primary Plan)
Justification: Only valid if strong buying emerges to defend the major support and reclaim the entire breakdown structure.
Trigger: A sustained move and close above the resistance at 82,300.
Entry: Long entry on a confirmed 15-minute close above 82,300.
Stop Loss (SL): Below 82,100.
Targets:
T1: 82,500 (Major supply zone).
T2: 82,800 (Extension target).
Bearish Scenario (Counter-Trend/Reversal Plan)
Justification: The breakdown of the steep channel and the heavy rejection from 82,300 favor continuation toward the next major support.
Entry: Short entry on a successful retest and rejection of the 82,000 - 82,100 zone (upper channel resistance). Alternatively, short a decisive break and 15-minute candle close below 81,600.
Stop Loss (SL): Place a stop loss above 82,300 (above the immediate swing high).
Targets:
T1: 81,600 (Major FVG support).
T2: 81,400 (Extension target).
Key Levels for Observation:
Immediate Decision Point: 81,800 - 82,100 zone.
Bearish Confirmation: A break and sustained move below 81,600.
Bullish Confirmation: A move back above 82,300.
Line in the Sand: 81,600. Below this level, the short-term bullish bias is nullified.
Disclaimer
The information and publications are not meant to be, and do not constitute, financial, investment, trading, or other types of advice or recommendations supplied or endorsed by TradingView. Read more in the Terms of Use.
Disclaimer
The information and publications are not meant to be, and do not constitute, financial, investment, trading, or other types of advice or recommendations supplied or endorsed by TradingView. Read more in the Terms of Use.