The market's performance on Friday, September 26, the Sensex has extended its aggressive correction, marking a severe breakdown of support levels. The market is firmly in a strong bearish trend across all timeframes.
Detailed Market Structure Breakdown
4-Hour Chart (Macro Trend)
Structure: The Sensex is in an accelerated corrective phase. It has broken through the 81,800-82,000 support and, more recently, the 81,000 psychological level. The price is now trading at the bottom of a steep descending channel and has entered the major demand zone of 80,400 - 80,600.
Key Levels:
Major Supply (Resistance): 81,000 - 81,200. This previous psychological support and minor consolidation zone is now the critical overhead resistance.
Major Demand (Support): 80,400 - 80,600. This area is the key "line in the sand" from the base of the previous uptrend. A sustained break below 80,400 would signal a deeper, structural correction toward 79,500.
Outlook: The trend is strongly bearish, but the index is positioned at a major demand confluence. A short-term bounce is possible, but the overall bias remains "sell on rise."
1-Hour Chart (Intermediate View)
Structure: The 1H chart is strongly bearish, trading deep within a descending channel. The price action is characterized by strong red candles and immediate rejection on any attempt to rise. The market closed right above the lower boundary of the channel.
Key Levels:
Immediate Resistance: The upper trendline of the descending channel, currently near 81,000.
Immediate Support: 80,300. This is the level that must be defended at the open.
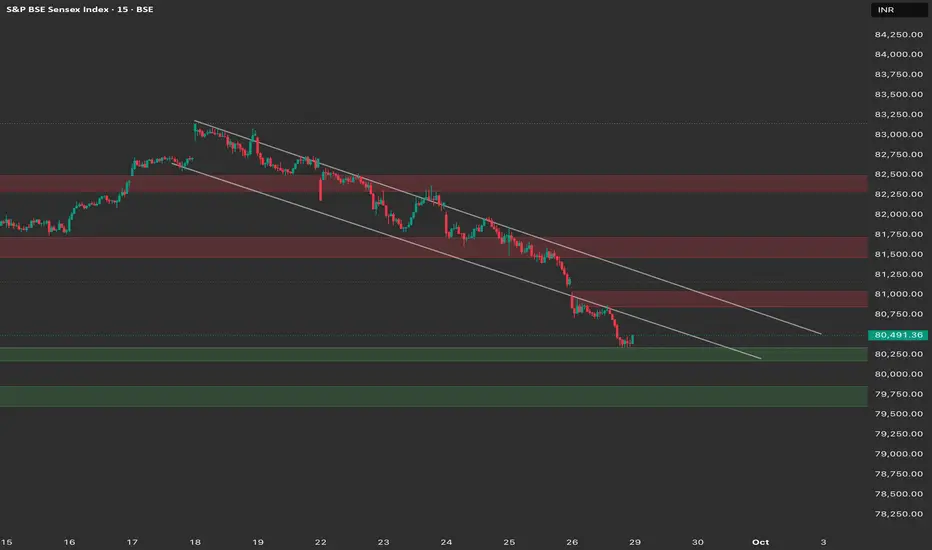
15-Minute Chart (Intraday View)
Structure: The 15M chart confirms the persistent intraday downtrend. The price broke the 81,000 support and saw an aggressive push lower before a small recovery. The pattern is one of consolidation followed by a breakdown (BOS), indicating firm bearish control.
Key Levels:
Intraday Supply: 80,800. This is the high of the recent small consolidation and the immediate resistance.
Intraday Demand: 80,300 - 80,400. The crucial support zone for the open.
Outlook: The primary strategy remains bearish.
Trade Plan (Monday, 29th September)
Market Outlook: The Sensex is bearish across all timeframes, located at a significant macro support level. The strategy hinges on the defense of 80,400.
Bearish Scenario (Primary Plan)
Justification: The continuation of the strong bearish trend following the break of the 81,800 and 81,000 supports.
Entry: Short entry on a decisive break and 15-minute candle close below 80,300.
Stop Loss (SL): Place a stop loss above 80,550 (above the immediate swing high).
Targets:
T1: 80,000 (Psychological support).
T2: 79,500 (Next major demand zone).
Bullish Scenario (Counter-Trend/Reversal Plan)
Justification: This is a high-risk, counter-trend plan. It relies on the macro demand zone at 80,400 - 80,600 successfully initiating a strong bounce.
Trigger: A reversal from the 80,300 - 80,500 zone (e.g., a hammer or bullish engulfing candle) or a sustained move and close above 81,000.
Entry: Long entry on a confirmed bounce from the support zone, or on a break above 81,000.
Stop Loss (SL): Below 80,250 (for a bounce trade) or 80,750 (for a breakout trade).
Targets:
T1: 81,000 (Upper channel resistance).
T2: 81,400 (Previous consolidation support now resistance).
Key Levels for Observation:
Immediate Decision Point: The 80,300 - 80,600 zone.
Bearish Confirmation: A break and sustained move below 80,300.
Bullish Confirmation: A recapture of the 81,000 level.
Line in the Sand: 80,400. The overall market structure will weaken significantly below this level.
Detailed Market Structure Breakdown
4-Hour Chart (Macro Trend)
Structure: The Sensex is in an accelerated corrective phase. It has broken through the 81,800-82,000 support and, more recently, the 81,000 psychological level. The price is now trading at the bottom of a steep descending channel and has entered the major demand zone of 80,400 - 80,600.
Key Levels:
Major Supply (Resistance): 81,000 - 81,200. This previous psychological support and minor consolidation zone is now the critical overhead resistance.
Major Demand (Support): 80,400 - 80,600. This area is the key "line in the sand" from the base of the previous uptrend. A sustained break below 80,400 would signal a deeper, structural correction toward 79,500.
Outlook: The trend is strongly bearish, but the index is positioned at a major demand confluence. A short-term bounce is possible, but the overall bias remains "sell on rise."
1-Hour Chart (Intermediate View)
Structure: The 1H chart is strongly bearish, trading deep within a descending channel. The price action is characterized by strong red candles and immediate rejection on any attempt to rise. The market closed right above the lower boundary of the channel.
Key Levels:
Immediate Resistance: The upper trendline of the descending channel, currently near 81,000.
Immediate Support: 80,300. This is the level that must be defended at the open.
15-Minute Chart (Intraday View)
Structure: The 15M chart confirms the persistent intraday downtrend. The price broke the 81,000 support and saw an aggressive push lower before a small recovery. The pattern is one of consolidation followed by a breakdown (BOS), indicating firm bearish control.
Key Levels:
Intraday Supply: 80,800. This is the high of the recent small consolidation and the immediate resistance.
Intraday Demand: 80,300 - 80,400. The crucial support zone for the open.
Outlook: The primary strategy remains bearish.
Trade Plan (Monday, 29th September)
Market Outlook: The Sensex is bearish across all timeframes, located at a significant macro support level. The strategy hinges on the defense of 80,400.
Bearish Scenario (Primary Plan)
Justification: The continuation of the strong bearish trend following the break of the 81,800 and 81,000 supports.
Entry: Short entry on a decisive break and 15-minute candle close below 80,300.
Stop Loss (SL): Place a stop loss above 80,550 (above the immediate swing high).
Targets:
T1: 80,000 (Psychological support).
T2: 79,500 (Next major demand zone).
Bullish Scenario (Counter-Trend/Reversal Plan)
Justification: This is a high-risk, counter-trend plan. It relies on the macro demand zone at 80,400 - 80,600 successfully initiating a strong bounce.
Trigger: A reversal from the 80,300 - 80,500 zone (e.g., a hammer or bullish engulfing candle) or a sustained move and close above 81,000.
Entry: Long entry on a confirmed bounce from the support zone, or on a break above 81,000.
Stop Loss (SL): Below 80,250 (for a bounce trade) or 80,750 (for a breakout trade).
Targets:
T1: 81,000 (Upper channel resistance).
T2: 81,400 (Previous consolidation support now resistance).
Key Levels for Observation:
Immediate Decision Point: The 80,300 - 80,600 zone.
Bearish Confirmation: A break and sustained move below 80,300.
Bullish Confirmation: A recapture of the 81,000 level.
Line in the Sand: 80,400. The overall market structure will weaken significantly below this level.
Disclaimer
The information and publications are not meant to be, and do not constitute, financial, investment, trading, or other types of advice or recommendations supplied or endorsed by TradingView. Read more in the Terms of Use.
Disclaimer
The information and publications are not meant to be, and do not constitute, financial, investment, trading, or other types of advice or recommendations supplied or endorsed by TradingView. Read more in the Terms of Use.