Detailed Market Structure Breakdown
4-Hour Chart (Macro Trend)
Structure: The Sensex has confirmed a strong bullish reversal. The price has decisively broken out of the steep descending corrective channel and is now trading above the 81,000 psychological mark. The structure has shifted from bearish to bullish, with the recent low at 80,200 acting as a strong bottom for the correction.
Key Levels:
Major Supply (Resistance): 81,600 - 81,800. This area remains the key overhead supply zone, which was a prior support/resistance flip zone.
Major Demand (Support): 80,400 - 80,600. This area is the key reversal zone. As long as the Sensex trades above 80,400, the bullish bounce is in control.
Outlook: The short-term bias is strongly bullish. The next clear target is the 81,600 - 81,800 supply zone.
1-Hour Chart (Intermediate View)
Structure: The 1H chart shows a clear ascending channel forming after the massive reversal. The market has established a clean pattern of higher highs and higher lows, confirming the short-term uptrend.
Key Levels:
Immediate Resistance: 81,400 (Upper boundary of the current ascending channel).
Immediate Support: 80,800 - 80,900 (The lower boundary of the ascending channel and the recent pivot low).
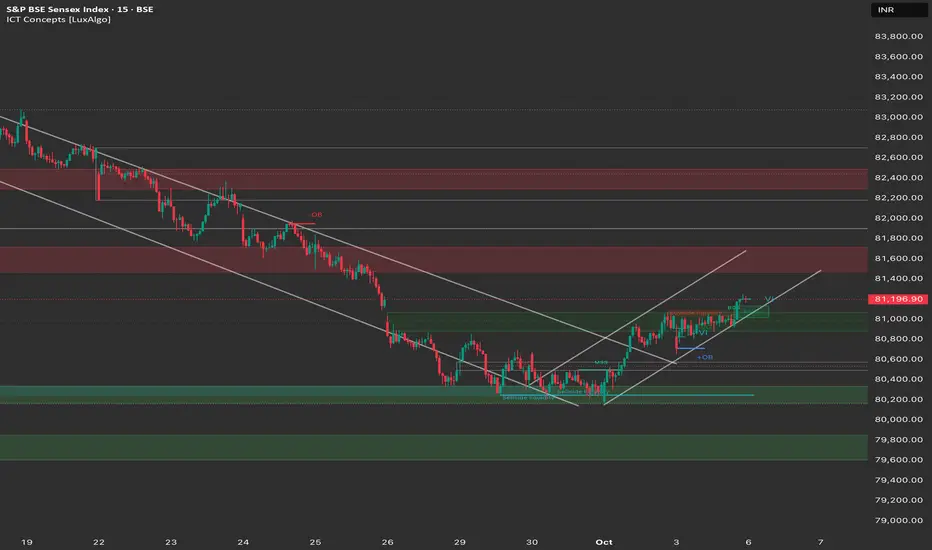
15-Minute Chart (Intraday View)
Structure: The 15M chart confirms strong bullish momentum. The index closed with a continuation pattern right at 81,200, having successfully retested the 80,600 support area.
Key Levels:
Intraday Supply: 81,400.
Intraday Demand: 81,000.
Outlook: Strongly Bullish.
📈 Trade Plan (Monday, 6th October)
Market Outlook: The Sensex is in a strong bounce phase, showing a clear bullish trend. The primary strategy will be to buy on dips or buy on continuation.
Bullish Scenario (Primary Plan)
Justification: The market has confirmed a strong reversal, and the structure is now clearly bullish. Continuation is expected.
Entry: Long entry on a decisive break and 15-minute candle close above 81,400 (breaking the ascending channel resistance). Alternatively, look for a dip entry near 80,900 (the lower channel trendline).
Stop Loss (SL): Place a stop loss below 80,650 (below the key macro support).
Targets:
T1: 81,600 (Major supply zone).
T2: 81,800 (Upper resistance).
T3: 82,200 (Extension target).
Bearish Scenario (Counter-Trend Plan)
Justification: This high-risk, counter-trend plan only becomes valid if the rally fails dramatically.
Trigger: A decisive break and 1-hour candle close below 80,800.
Entry: Short entry below 80,800.
Stop Loss (SL): Above 81,050.
Targets:
T1: 80,500 (Key reversal zone).
T2: 80,200 (Deeper demand zone).
Key Levels for Observation:
Immediate Decision Point: 81,000 - 81,400 zone.
Bullish Confirmation: A break and sustained move above 81,400.
Bearish Warning: A move below 80,800 suggests consolidation or reversal.
Line in the Sand: 80,600. Below this, the short-term bias shifts back to neutral-to-bearish.
4-Hour Chart (Macro Trend)
Structure: The Sensex has confirmed a strong bullish reversal. The price has decisively broken out of the steep descending corrective channel and is now trading above the 81,000 psychological mark. The structure has shifted from bearish to bullish, with the recent low at 80,200 acting as a strong bottom for the correction.
Key Levels:
Major Supply (Resistance): 81,600 - 81,800. This area remains the key overhead supply zone, which was a prior support/resistance flip zone.
Major Demand (Support): 80,400 - 80,600. This area is the key reversal zone. As long as the Sensex trades above 80,400, the bullish bounce is in control.
Outlook: The short-term bias is strongly bullish. The next clear target is the 81,600 - 81,800 supply zone.
1-Hour Chart (Intermediate View)
Structure: The 1H chart shows a clear ascending channel forming after the massive reversal. The market has established a clean pattern of higher highs and higher lows, confirming the short-term uptrend.
Key Levels:
Immediate Resistance: 81,400 (Upper boundary of the current ascending channel).
Immediate Support: 80,800 - 80,900 (The lower boundary of the ascending channel and the recent pivot low).
15-Minute Chart (Intraday View)
Structure: The 15M chart confirms strong bullish momentum. The index closed with a continuation pattern right at 81,200, having successfully retested the 80,600 support area.
Key Levels:
Intraday Supply: 81,400.
Intraday Demand: 81,000.
Outlook: Strongly Bullish.
📈 Trade Plan (Monday, 6th October)
Market Outlook: The Sensex is in a strong bounce phase, showing a clear bullish trend. The primary strategy will be to buy on dips or buy on continuation.
Bullish Scenario (Primary Plan)
Justification: The market has confirmed a strong reversal, and the structure is now clearly bullish. Continuation is expected.
Entry: Long entry on a decisive break and 15-minute candle close above 81,400 (breaking the ascending channel resistance). Alternatively, look for a dip entry near 80,900 (the lower channel trendline).
Stop Loss (SL): Place a stop loss below 80,650 (below the key macro support).
Targets:
T1: 81,600 (Major supply zone).
T2: 81,800 (Upper resistance).
T3: 82,200 (Extension target).
Bearish Scenario (Counter-Trend Plan)
Justification: This high-risk, counter-trend plan only becomes valid if the rally fails dramatically.
Trigger: A decisive break and 1-hour candle close below 80,800.
Entry: Short entry below 80,800.
Stop Loss (SL): Above 81,050.
Targets:
T1: 80,500 (Key reversal zone).
T2: 80,200 (Deeper demand zone).
Key Levels for Observation:
Immediate Decision Point: 81,000 - 81,400 zone.
Bullish Confirmation: A break and sustained move above 81,400.
Bearish Warning: A move below 80,800 suggests consolidation or reversal.
Line in the Sand: 80,600. Below this, the short-term bias shifts back to neutral-to-bearish.
Disclaimer
The information and publications are not meant to be, and do not constitute, financial, investment, trading, or other types of advice or recommendations supplied or endorsed by TradingView. Read more in the Terms of Use.
Disclaimer
The information and publications are not meant to be, and do not constitute, financial, investment, trading, or other types of advice or recommendations supplied or endorsed by TradingView. Read more in the Terms of Use.