Based on the charts and the market's performance on Thursday, October 16, the Sensex experienced a dramatic bullish breakout, surging to a 4-week high and confirming the continuation of its primary uptrend.
Detailed Market Structure Breakdown
4-Hour Chart (Macro Trend)
Structure: The Sensex is in a high-conviction bullish trend. The price has decisively broken out above the major supply zone of 82,300 - 82,500 and is now trading aggressively towards its next major target. The structure is a clear ascending channel, with strong bullish momentum evident across the chart.
Key Levels:
Major Supply (Resistance): 83,600. This area aligns with the upper boundary of the steep ascending channel and a strong resistance line.
Major Demand (Support): 82,400 - 82,600. This area, which includes the previous resistance and a key FVG (Fair Value Gap), is the new must-hold demand zone for the bulls.
Outlook: The short-term bias is aggressively bullish. The market is poised to challenge the 83,600 level and potentially move higher.
1-Hour Chart (Intermediate View)
Structure: The 1H chart shows a clear Break of Structure (BOS) to the upside. The price is trading strongly within a well-defined ascending channel. The close suggests very strong buyer conviction.
Key Levels:
Immediate Resistance: 83,600.
Immediate Support: 83,000 (Psychological level and the lower trendline of the channel).
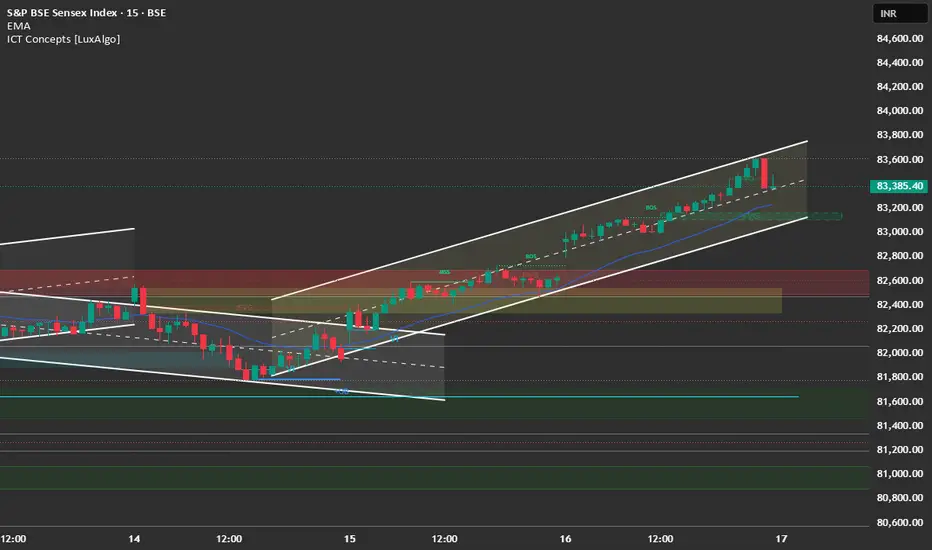
15-Minute Chart (Intraday View)
Structure: The 15M chart confirms the powerful bullish momentum. The market closed right below the day's high after a brief rejection at the top of the channel. The structure suggests immediate follow-through strength is likely.
Key Levels:
Intraday Supply: 83,600.
Intraday Demand: 83,200 (Recent consolidation zone).
Outlook: Aggressively Bullish.
📈 Trade Plan (Friday, 17th October)
Market Outlook: The Sensex is displaying aggressive momentum, led by private banks and financial services. The primary strategy will be to buy on continuation.
Bullish Scenario (Primary Plan)
Justification: The strong breakout and close above the 82,600 zone favor continuation. The next major target is the upper channel boundary.
Entry: Long entry on a decisive break and 15-minute candle close above 83,600. Alternatively, look for a dip entry near 83,200 - 83,300 (the immediate support zone).
Stop Loss (SL): Place a stop loss below 82,900 (below the lower channel trendline).
Targets:
T1: 83,850 (Extension target).
T2: 84,200 (Next resistance).
Bearish Scenario (Counter-Trend Plan)
Justification: High-risk. Only valid if sharp profit booking occurs, potentially triggered by mixed IT earnings or unexpected news.
Trigger: A decisive break and 1-hour candle close below 82,600.
Entry: Short entry below 82,600.
Stop Loss (SL): Above 82,900.
Targets:
T1: 82,300 (Major FVG support).
T2: 82,000 (Psychological support).
Key Levels for Observation:
Immediate Decision Point: 83,200 - 83,600 zone.
Bullish Confirmation: A break and sustained move above 83,600.
Bearish Warning: A move below 83,000 suggests the rally is failing.
Major Event: Infosys, LTIMindtree, Wipro Q2 Results (will influence overall sentiment).
Line in the Sand: 82,600. Below this level, the short-term bullish bias is nullified.
Watch the following video for a Bank Nifty and Nifty outlook: Nifty targeting 25,800 amid strong Q2 numbers; SBI, Shriram Finance among top picks
Detailed Market Structure Breakdown
4-Hour Chart (Macro Trend)
Structure: The Sensex is in a high-conviction bullish trend. The price has decisively broken out above the major supply zone of 82,300 - 82,500 and is now trading aggressively towards its next major target. The structure is a clear ascending channel, with strong bullish momentum evident across the chart.
Key Levels:
Major Supply (Resistance): 83,600. This area aligns with the upper boundary of the steep ascending channel and a strong resistance line.
Major Demand (Support): 82,400 - 82,600. This area, which includes the previous resistance and a key FVG (Fair Value Gap), is the new must-hold demand zone for the bulls.
Outlook: The short-term bias is aggressively bullish. The market is poised to challenge the 83,600 level and potentially move higher.
1-Hour Chart (Intermediate View)
Structure: The 1H chart shows a clear Break of Structure (BOS) to the upside. The price is trading strongly within a well-defined ascending channel. The close suggests very strong buyer conviction.
Key Levels:
Immediate Resistance: 83,600.
Immediate Support: 83,000 (Psychological level and the lower trendline of the channel).
15-Minute Chart (Intraday View)
Structure: The 15M chart confirms the powerful bullish momentum. The market closed right below the day's high after a brief rejection at the top of the channel. The structure suggests immediate follow-through strength is likely.
Key Levels:
Intraday Supply: 83,600.
Intraday Demand: 83,200 (Recent consolidation zone).
Outlook: Aggressively Bullish.
📈 Trade Plan (Friday, 17th October)
Market Outlook: The Sensex is displaying aggressive momentum, led by private banks and financial services. The primary strategy will be to buy on continuation.
Bullish Scenario (Primary Plan)
Justification: The strong breakout and close above the 82,600 zone favor continuation. The next major target is the upper channel boundary.
Entry: Long entry on a decisive break and 15-minute candle close above 83,600. Alternatively, look for a dip entry near 83,200 - 83,300 (the immediate support zone).
Stop Loss (SL): Place a stop loss below 82,900 (below the lower channel trendline).
Targets:
T1: 83,850 (Extension target).
T2: 84,200 (Next resistance).
Bearish Scenario (Counter-Trend Plan)
Justification: High-risk. Only valid if sharp profit booking occurs, potentially triggered by mixed IT earnings or unexpected news.
Trigger: A decisive break and 1-hour candle close below 82,600.
Entry: Short entry below 82,600.
Stop Loss (SL): Above 82,900.
Targets:
T1: 82,300 (Major FVG support).
T2: 82,000 (Psychological support).
Key Levels for Observation:
Immediate Decision Point: 83,200 - 83,600 zone.
Bullish Confirmation: A break and sustained move above 83,600.
Bearish Warning: A move below 83,000 suggests the rally is failing.
Major Event: Infosys, LTIMindtree, Wipro Q2 Results (will influence overall sentiment).
Line in the Sand: 82,600. Below this level, the short-term bullish bias is nullified.
Watch the following video for a Bank Nifty and Nifty outlook: Nifty targeting 25,800 amid strong Q2 numbers; SBI, Shriram Finance among top picks
Disclaimer
The information and publications are not meant to be, and do not constitute, financial, investment, trading, or other types of advice or recommendations supplied or endorsed by TradingView. Read more in the Terms of Use.
Disclaimer
The information and publications are not meant to be, and do not constitute, financial, investment, trading, or other types of advice or recommendations supplied or endorsed by TradingView. Read more in the Terms of Use.