Based on the charts and the market's performance on Wednesday, October 15, the Sensex experienced a strong bullish continuation and is positioned to re-challenge the recent high.
Detailed Market Structure Breakdown
4-Hour Chart (Macro Trend)
Structure: The Sensex has confirmed a strong bullish trend resumption, breaking out of the corrective descending channel that formed last week. The price is now trading within a clear ascending channel and has closed right below the immediate overhead supply.
Key Levels:
Major Supply (Resistance): 82,700 - 82,900. This area is the critical hurdle, aligning with the upper channel trendline and the recent swing high. A decisive breakout here is needed to target 83,000 and beyond.
Major Demand (Support): 82,000 - 82,200. This area, which includes the lower trendline of the ascending channel and the psychological 82,000 mark, is the must-hold zone for the continuation of the rally.
Outlook: The short-term bias is strongly bullish. The market is poised to challenge the 82,700 - 82,900 resistance band.
1-Hour Chart (Intermediate View)
Structure: The 1H chart shows a clear Break of Structure (BOS) on the upside, as the price broke the resistance trendline and the immediate swing high. The index is strongly in an ascending channel, confirming buyer conviction.
Key Levels:
Immediate Resistance: 82,800.
Immediate Support: 82,300 (Recent swing low/consolidation zone).
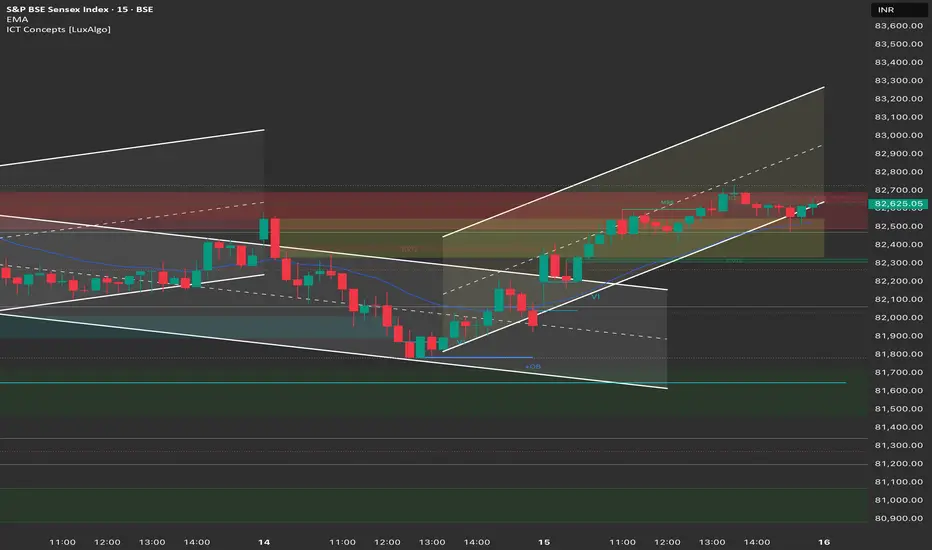
15-Minute Chart (Intraday View)
Structure: The 15M chart confirms the strong bullish momentum. The market has closed right at the 82,600 level, after successfully defending the 82,000 support. It is currently consolidating in a small bullish flag pattern at the top of the channel.
Key Levels:
Intraday Supply: 82,800.
Intraday Demand: 82,400.
Outlook: Strongly Bullish.
📈 Trade Plan (Thursday, 16th October)
Market Outlook: The Sensex is displaying strong bullish momentum and is positioned for a breakout towards new highs. The primary strategy will be to buy on continuation.
Bullish Scenario (Primary Plan)
Justification: The market has confirmed a strong bullish reversal and is trading near the upper resistance band. Continuation is expected.
Entry: Long entry on a decisive break and 15-minute candle close above 82,800. Alternatively, look for a dip entry near 82,400 (the immediate support/FVG zone).
Stop Loss (SL): Place a stop loss below 82,200 (below the lower channel trendline).
Targets:
T1: 83,000 (Psychological target).
T2: 83,300 (Extension target).
Bearish Scenario (Counter-Trend Plan)
Justification: Only valid if there is sharp profit booking or disappointing Infosys/Wipro/LTIMindtree Q2 results that causes the price to break the bullish structure.
Trigger: A decisive break and 1-hour candle close below 82,000.
Entry: Short entry below 82,000.
Stop Loss (SL): Above 82,300.
Targets:
T1: 81,800 (Major FVG support).
T2: 81,600 (Next major demand zone).
Key Levels for Observation:
Immediate Decision Point: 82,400 - 82,800 zone.
Bullish Confirmation: A break and sustained move above 82,800.
Bearish Warning: A move below 82,200 suggests the rally is failing.
Major Event: Infosys, LTIMindtree, Wipro Q2 Results (will influence overall sentiment).
Line in the Sand: 82,000. Below this level, the short-term bullish bias is nullified.
Detailed Market Structure Breakdown
4-Hour Chart (Macro Trend)
Structure: The Sensex has confirmed a strong bullish trend resumption, breaking out of the corrective descending channel that formed last week. The price is now trading within a clear ascending channel and has closed right below the immediate overhead supply.
Key Levels:
Major Supply (Resistance): 82,700 - 82,900. This area is the critical hurdle, aligning with the upper channel trendline and the recent swing high. A decisive breakout here is needed to target 83,000 and beyond.
Major Demand (Support): 82,000 - 82,200. This area, which includes the lower trendline of the ascending channel and the psychological 82,000 mark, is the must-hold zone for the continuation of the rally.
Outlook: The short-term bias is strongly bullish. The market is poised to challenge the 82,700 - 82,900 resistance band.
1-Hour Chart (Intermediate View)
Structure: The 1H chart shows a clear Break of Structure (BOS) on the upside, as the price broke the resistance trendline and the immediate swing high. The index is strongly in an ascending channel, confirming buyer conviction.
Key Levels:
Immediate Resistance: 82,800.
Immediate Support: 82,300 (Recent swing low/consolidation zone).
15-Minute Chart (Intraday View)
Structure: The 15M chart confirms the strong bullish momentum. The market has closed right at the 82,600 level, after successfully defending the 82,000 support. It is currently consolidating in a small bullish flag pattern at the top of the channel.
Key Levels:
Intraday Supply: 82,800.
Intraday Demand: 82,400.
Outlook: Strongly Bullish.
📈 Trade Plan (Thursday, 16th October)
Market Outlook: The Sensex is displaying strong bullish momentum and is positioned for a breakout towards new highs. The primary strategy will be to buy on continuation.
Bullish Scenario (Primary Plan)
Justification: The market has confirmed a strong bullish reversal and is trading near the upper resistance band. Continuation is expected.
Entry: Long entry on a decisive break and 15-minute candle close above 82,800. Alternatively, look for a dip entry near 82,400 (the immediate support/FVG zone).
Stop Loss (SL): Place a stop loss below 82,200 (below the lower channel trendline).
Targets:
T1: 83,000 (Psychological target).
T2: 83,300 (Extension target).
Bearish Scenario (Counter-Trend Plan)
Justification: Only valid if there is sharp profit booking or disappointing Infosys/Wipro/LTIMindtree Q2 results that causes the price to break the bullish structure.
Trigger: A decisive break and 1-hour candle close below 82,000.
Entry: Short entry below 82,000.
Stop Loss (SL): Above 82,300.
Targets:
T1: 81,800 (Major FVG support).
T2: 81,600 (Next major demand zone).
Key Levels for Observation:
Immediate Decision Point: 82,400 - 82,800 zone.
Bullish Confirmation: A break and sustained move above 82,800.
Bearish Warning: A move below 82,200 suggests the rally is failing.
Major Event: Infosys, LTIMindtree, Wipro Q2 Results (will influence overall sentiment).
Line in the Sand: 82,000. Below this level, the short-term bullish bias is nullified.
Disclaimer
The information and publications are not meant to be, and do not constitute, financial, investment, trading, or other types of advice or recommendations supplied or endorsed by TradingView. Read more in the Terms of Use.
Disclaimer
The information and publications are not meant to be, and do not constitute, financial, investment, trading, or other types of advice or recommendations supplied or endorsed by TradingView. Read more in the Terms of Use.