🔎 Current Market Context
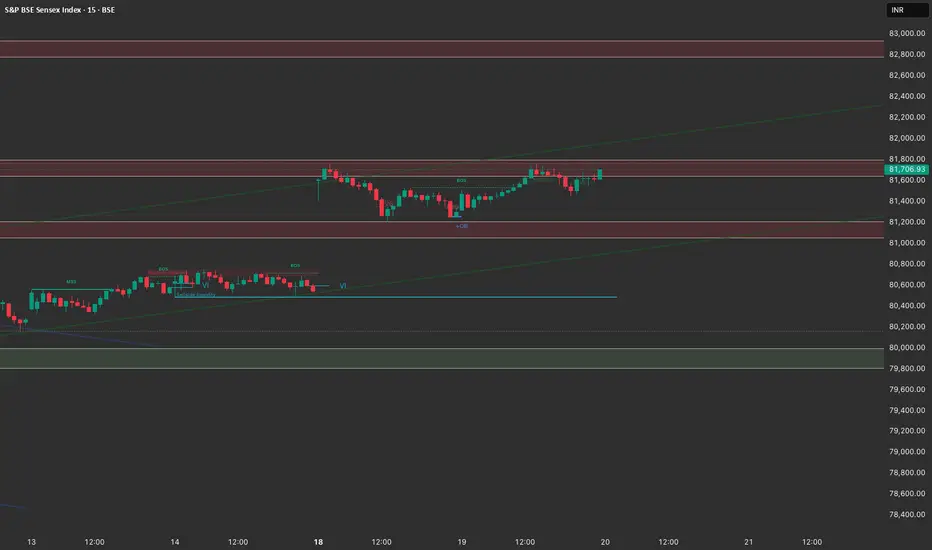
Price is currently trading around 81,700 after a steady recovery from 80,000 support.
On the 4H chart, Sensex is testing a supply/FVG zone (81,600–81,800).
Multiple rejections in the 1H / 15M chart show sellers are active at this resistance.
Structure is still bullish overall with higher lows, but upside momentum is slowing at resistance.
📍 Key Levels
Immediate Resistance (Supply/FVG) → 81,600 – 81,800
Next Major Resistance → 82,600 – 82,800
Immediate Support Zone → 81,200 – 81,300
Major Support (Demand Zone) → 79,800 – 80,000
🎯 Intraday Trading Plan
Bullish Scenario (Breakout Play)
If price sustains above 81,800, expect continuation toward 82,600–82,800.
Confirmation: Strong bullish candle closing above 81,800 with volume.
Intraday target: +300 to +500 points.
Bearish Scenario (Rejection Play)
If Sensex fails to cross 81,800 and shows rejection (wicks/engulfing), short entries can be taken.
Downside target: 81,200 → 80,800.
Deeper pullback possible toward 80,000 if weakness continues.
Range Scenario (Scalping Play)
Between 81,200 – 81,800, expect sideways chop.
Use mean reversion trades: buy near 81,200, sell near 81,800 with tight SL.
⚖️ Bias & Probability
Overall Bias: Bullish but near resistance, caution required.
High probability trade:
Short-term rejection around 81,800 (scalp shorts).
OR breakout longs only if we get strong momentum above 81,800.
✅ In summary:
Above 81,800 → Buy for 82,600–82,800.
Below 81,800 with rejection → Short toward 81,200–80,800.
Safe intraday plan: Trade the range until a breakout confirms direction.
Disclaimer
The information and publications are not meant to be, and do not constitute, financial, investment, trading, or other types of advice or recommendations supplied or endorsed by TradingView. Read more in the Terms of Use.
Disclaimer
The information and publications are not meant to be, and do not constitute, financial, investment, trading, or other types of advice or recommendations supplied or endorsed by TradingView. Read more in the Terms of Use.