On Monday, September 23, the Sensex has experienced a significant correction, breaking below its rising channel. While the market did manage to recover some of its intraday losses, the overall sentiment remains cautiously bearish for the short term. The Sensex closed at 82,149.72, down marginally by 0.01% on the day.
Detailed Market Structure Breakdown
4-Hour Chart (Macro Trend)
Structure: The long-term trend remains bullish, as the index is still trading above its early September lows. However, the last few candles show a sharp break below the rising channel, indicating a significant shift in the immediate trend. The market is now backtesting a crucial support level around 82,000.
Key Levels:
Major Supply (Resistance): 82,800 - 83,000. This area served as support on the way up and is now a major resistance. Any bounce is likely to be met with selling pressure in this zone.
Major Demand (Support): The most critical support is the 81,800 - 82,000 zone. This area, which includes a prior breakout level and a FVG (Fair Value Gap), is the key "line in the sand" for the long-term bullish trend. A break below this would signal a major trend reversal.
1-Hour Chart (Intermediate View)
Structure: The 1H chart shows a clear MSS (Market Structure Shift) to the downside. The price has broken below the lower trendline of the rising channel and is now making lower highs and lower lows. The market is in a clear downtrend on this timeframe.
Key Levels:
Immediate Resistance: The 82,400 level is a crucial resistance now.
Immediate Support: The 81,800 level is the key support to watch. The price has already tested this zone.
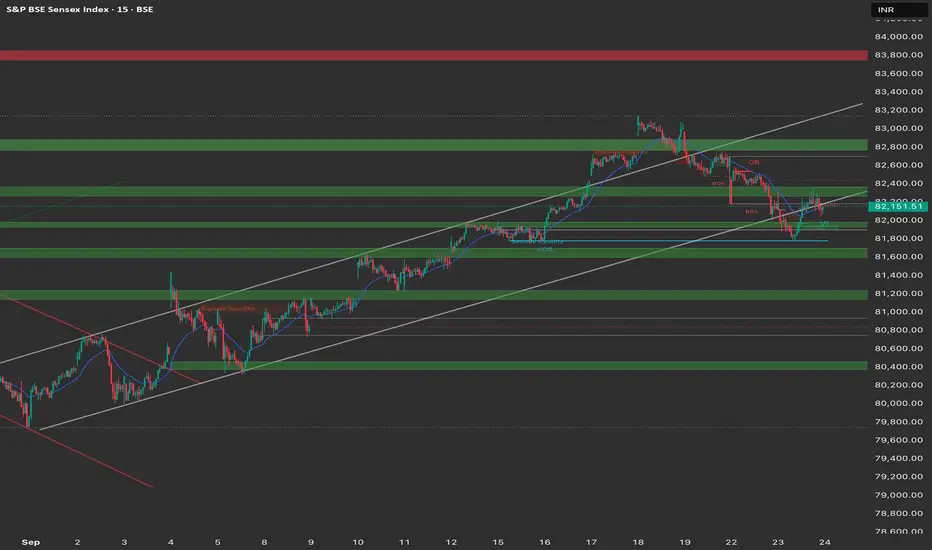
15-Minute Chart (Intraday View)
Structure: The 15M chart shows that the index is in a corrective phase, having bounced off the crucial 81,800 support. The price is now trading within a small range, consolidating its recent moves. The volatility of the past two days indicates a tussle between buyers and sellers.
Key Levels:
Intraday Supply: The 82,200 area, which is the high of the recent consolidation.
Intraday Demand: The low of the recent consolidation and the intraday low, near 81,800.
Outlook: The intraday bias is cautiously bearish. The market is likely to remain volatile as it decides its next move.
Trade Plan (Tuesday, 24th September)
Market Outlook: The Sensex has shifted to a short-term bearish phase. A "sell on rise" strategy seems more favorable, but a strong reversal from the key 81,800 support level is also a possibility.
Bearish Scenario (Primary Plan)
Justification: The market has shown a clear change in structure with a breakdown of key levels. The path of least resistance is to the downside.
Entry: Look for a short entry if the price retests the 82,400 level and shows signs of rejection with a bearish candlestick pattern. Alternatively, a breakdown and 15-minute close below 81,800 would trigger a short entry.
Stop Loss (SL): Place a stop loss above 82,450.
Targets:
T1: 81,600 (Next major support).
T2: 81,400 (Psychological level and demand zone).
Bullish Scenario (Counter-Trend Plan)
Justification: This is a counter-trend plan and should be approached with caution. It is based on the possibility of a strong bounce from a key support level.
Trigger: A strong bullish reversal candle (e.g., a hammer or engulfing pattern) near the 81,800 - 82,000 demand zone.
Entry: Long entry on a confirmed bounce from the demand zone.
Stop Loss (SL): Below 81,700.
Targets:
T1: 82,400 (Intraday resistance).
T2: 82,600 (Recent swing high).
Key Levels for Observation:
Immediate Decision Point: The 81,800 - 82,400 zone.
Bearish Confirmation: A break and sustained move below 81,800.
Bullish Confirmation: A recapture of the 82,400 level.
Line in the Sand: The 81,800 - 82,000 zone. The overall bullish trend is in jeopardy if this level is decisively broken.
Disclaimer
The information and publications are not meant to be, and do not constitute, financial, investment, trading, or other types of advice or recommendations supplied or endorsed by TradingView. Read more in the Terms of Use.
Disclaimer
The information and publications are not meant to be, and do not constitute, financial, investment, trading, or other types of advice or recommendations supplied or endorsed by TradingView. Read more in the Terms of Use.