Detailed Market Structure Breakdown
4-Hour Chart (Macro Trend)
Structure: The Sensex is now in a Corrective Phase within its broader uptrend. The price was aggressively rejected from the 85,300 - 85,600 supply zone (recent high). The price has broken below the lower trendline of the immediate ascending channel, confirming a Market Structure Shift (MSS) to the downside. The strong bearish candle closed near the lower boundary of the broader corrective channel.
Key Levels:
Major Supply (Resistance): 84,766 - 85,278. This area (the breakdown level and previous swing high) is the immediate overhead resistance.
Major Demand (Support): 83,800 - 84,200. This area aligns with the lower trendline of the current corrective pattern and a strong FVG (Fair Value Gap), making it the must-hold zone for the medium-term rally [refer to charts].
Outlook: The short-term bias is Bearish. The market is expected to seek lower support levels around 83,800.
1-Hour Chart (Intermediate View)
Structure: The 1H chart clearly shows the massive selling pressure that followed the failure at the high. The price has broken below the 9-period EMA and the lower trendline of the immediate ascending channel. The market is now trading right on the 84,400 support, which is the lower trendline of the channel.
Key Levels:
Immediate Resistance: 84,766 (The breakdown level/FVG).
Immediate Support: 84,200 (Lower boundary of the channel).
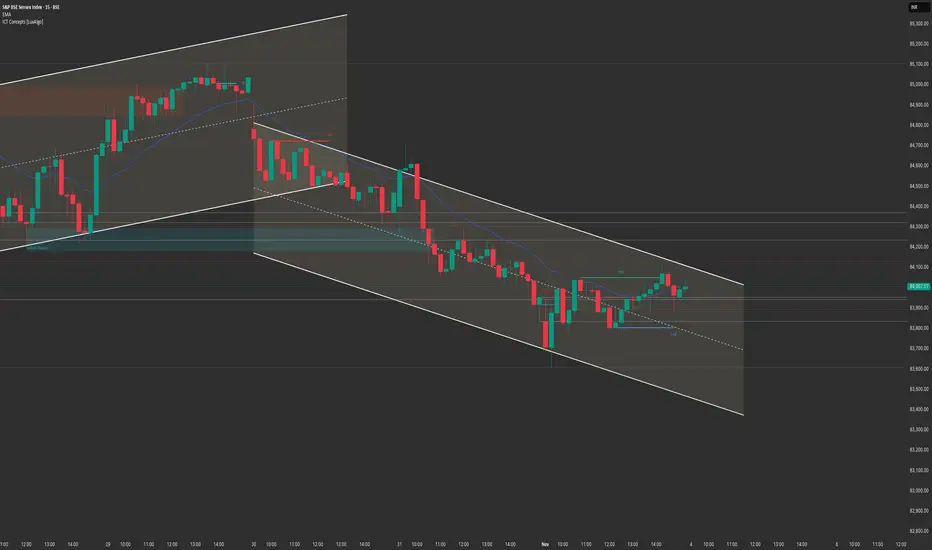
15-Minute Chart (Intraday View)
Structure: The 15M chart confirms the steep descending channel formed during the correction. The price closed near the lower boundary of the channel, breaking below the immediate swing low and confirming intraday bearish control.
Key Levels:
Intraday Supply: 84,800 (Upper channel trendline).
Intraday Demand: 84,000 - 84,200.
Outlook: Strongly Bearish for the session open. A "Sell on Rise" strategy is highly favored.
📈 Structure Analysis & Trade Plan: 31st October
Market Outlook: The Sensex witnessed an aggressive reversal after failing to break the recent high, fueled by the US Federal Reserve decision and related FII outflows. The primary strategy is to sell the breakdown or sell into any weak rise.
Bearish Scenario (Primary Plan: Correction Continuation)
Justification: The aggressive rejection from the supply zone and the breakdown of the short-term bullish structure favor continuation toward the main FVG support.
Entry: Short entry on a decisive break and 15-minute candle close below 84,200. Alternatively, short a retest and rejection of the 84,766 level (upper channel/FVG).
Stop Loss (SL): Place a stop loss above 85,000 (above the high of the breakdown).
Targets:
T1: 83,600 (Major FVG demand zone).
T2: 83,111 (Major macro support).
Bullish Scenario (Counter-Trend/Reversal)
Justification: Only valid if the market opens with a massive gap-up that negates the current selling structure, possibly due to a swift change in sentiment post-Fed.
Trigger: A sustained move and close above 85,300.
Entry: Long entry on a confirmed 15-minute close above 85,300.
Stop Loss (SL): Below 84,800.
Targets:
T1: 85,600 (Upper channel boundary).
T2: 86,000 (All-Time High retest).
Key Levels for Observation:
Immediate Decision Point: 84,200 - 84,766 zone.
Bearish Confirmation: Sustained trade below 84,200.
Bullish Warning: A move back above 84,766.
Line in the Sand: 84,200. Below this level, the short-term bullish bias is strongly bearish.
Crucial Event: The US Federal Reserve policy decision (announced post-market yesterday) is the main driver of volatility today.
4-Hour Chart (Macro Trend)
Structure: The Sensex is now in a Corrective Phase within its broader uptrend. The price was aggressively rejected from the 85,300 - 85,600 supply zone (recent high). The price has broken below the lower trendline of the immediate ascending channel, confirming a Market Structure Shift (MSS) to the downside. The strong bearish candle closed near the lower boundary of the broader corrective channel.
Key Levels:
Major Supply (Resistance): 84,766 - 85,278. This area (the breakdown level and previous swing high) is the immediate overhead resistance.
Major Demand (Support): 83,800 - 84,200. This area aligns with the lower trendline of the current corrective pattern and a strong FVG (Fair Value Gap), making it the must-hold zone for the medium-term rally [refer to charts].
Outlook: The short-term bias is Bearish. The market is expected to seek lower support levels around 83,800.
1-Hour Chart (Intermediate View)
Structure: The 1H chart clearly shows the massive selling pressure that followed the failure at the high. The price has broken below the 9-period EMA and the lower trendline of the immediate ascending channel. The market is now trading right on the 84,400 support, which is the lower trendline of the channel.
Key Levels:
Immediate Resistance: 84,766 (The breakdown level/FVG).
Immediate Support: 84,200 (Lower boundary of the channel).
15-Minute Chart (Intraday View)
Structure: The 15M chart confirms the steep descending channel formed during the correction. The price closed near the lower boundary of the channel, breaking below the immediate swing low and confirming intraday bearish control.
Key Levels:
Intraday Supply: 84,800 (Upper channel trendline).
Intraday Demand: 84,000 - 84,200.
Outlook: Strongly Bearish for the session open. A "Sell on Rise" strategy is highly favored.
📈 Structure Analysis & Trade Plan: 31st October
Market Outlook: The Sensex witnessed an aggressive reversal after failing to break the recent high, fueled by the US Federal Reserve decision and related FII outflows. The primary strategy is to sell the breakdown or sell into any weak rise.
Bearish Scenario (Primary Plan: Correction Continuation)
Justification: The aggressive rejection from the supply zone and the breakdown of the short-term bullish structure favor continuation toward the main FVG support.
Entry: Short entry on a decisive break and 15-minute candle close below 84,200. Alternatively, short a retest and rejection of the 84,766 level (upper channel/FVG).
Stop Loss (SL): Place a stop loss above 85,000 (above the high of the breakdown).
Targets:
T1: 83,600 (Major FVG demand zone).
T2: 83,111 (Major macro support).
Bullish Scenario (Counter-Trend/Reversal)
Justification: Only valid if the market opens with a massive gap-up that negates the current selling structure, possibly due to a swift change in sentiment post-Fed.
Trigger: A sustained move and close above 85,300.
Entry: Long entry on a confirmed 15-minute close above 85,300.
Stop Loss (SL): Below 84,800.
Targets:
T1: 85,600 (Upper channel boundary).
T2: 86,000 (All-Time High retest).
Key Levels for Observation:
Immediate Decision Point: 84,200 - 84,766 zone.
Bearish Confirmation: Sustained trade below 84,200.
Bullish Warning: A move back above 84,766.
Line in the Sand: 84,200. Below this level, the short-term bullish bias is strongly bearish.
Crucial Event: The US Federal Reserve policy decision (announced post-market yesterday) is the main driver of volatility today.
Disclaimer
The information and publications are not meant to be, and do not constitute, financial, investment, trading, or other types of advice or recommendations supplied or endorsed by TradingView. Read more in the Terms of Use.
Disclaimer
The information and publications are not meant to be, and do not constitute, financial, investment, trading, or other types of advice or recommendations supplied or endorsed by TradingView. Read more in the Terms of Use.