Detailed Market Structure Breakdown
4-Hour Chart (Macro Trend)
Structure: The long-term trend remains bullish, but the index has decisively broken down from its short-term rising channel and is now trading within a steep corrective channel. The close is right at the 81,800 - 82,000 major demand zone. A sustained break below this zone would confirm a significant acceleration of the corrective move.
Key Levels:
Major Supply (Resistance): 82,400. This level was a prior support and a consolidation high, now acting as a major resistance.
Major Demand (Support): 81,800 - 82,000. This is the most critical support zone. It represents a large FVG (Fair Value Gap) and a prior breakout level. A break below 81,800 would turn the 4H chart fully bearish.
1-Hour Chart (Intermediate View)
Structure: The 1H chart shows a clear continuation of the MSS (Market Structure Shift) to the downside. The price is trading within a descending channel and has consistently made lower highs and lower lows. The market closed below its immediate horizontal support, indicating strong selling pressure.
Key Levels:
Immediate Resistance: 82,000. This is the key psychological and technical level the bulls must reclaim.
Immediate Support: 81,600. This is the next support level that the market is likely to test.
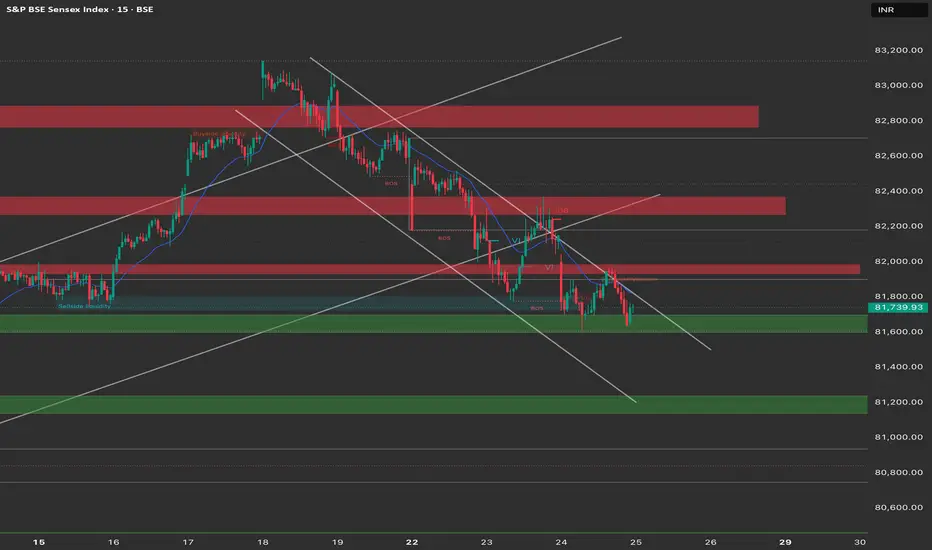
15-Minute Chart (Intraday View)
Structure: The 15M chart confirms the strong intraday downtrend. The price broke the 82,000 psychological support and bounced back to retest the broken level before falling again (classical breakdown pattern). The index closed near its lows, confirming bearish control.
Key Levels:
Intraday Supply: 82,000 - 82,200 (Order Block and psychological resistance).
Intraday Demand: 81,600. This is the immediate support level.
Outlook: The intraday bias is strongly bearish. A "sell on rise" strategy is favored as long as the price trades below 82,000.
Trade Plan (Thursday, 25th September)
Market Outlook: The Sensex is in a clear short-term bearish phase. The primary strategy should focus on shorting on strength or breakdown.
Bearish Scenario (Primary Plan)
Justification: The breakdown of the 82,000 support is a significant bearish signal, confirming the short-term downtrend.
Entry: Short entry on a successful retest of the 82,000 level and rejection (sell on rise). Alternatively, a decisive break and 15-minute close below 81,600 would be a breakdown entry.
Stop Loss (SL): Place a stop loss above 82,250 (above the recent OB).
Targets:
T1: 81,600 (Immediate support/breakdown trigger).
T2: 81,400 (Next major demand zone).
T3: 81,200 (Extension target).
Bullish Scenario (Counter-Trend Plan)
Justification: This is a counter-trend plan and should be approached with caution. It is based on a potential strong short-covering bounce.
Trigger: A strong bullish reversal candle (e.g., engulfing) or a sustained move and close above 82,200.
Entry: Long entry above 82,200.
Stop Loss (SL): Below 82,000.
Targets:
T1: 82,400 (Recent swing high and resistance).
T2: 82,600 (Next major supply zone).
Key Levels for Observation:
Immediate Decision Point: The 81,800 - 82,000 zone.
Bearish Confirmation: A break and sustained move below 81,800.
Bullish Confirmation: A recapture of the 82,000 level.
Line in the Sand: 81,800. A break below this level is a strong signal of short-term trend reversal.
4-Hour Chart (Macro Trend)
Structure: The long-term trend remains bullish, but the index has decisively broken down from its short-term rising channel and is now trading within a steep corrective channel. The close is right at the 81,800 - 82,000 major demand zone. A sustained break below this zone would confirm a significant acceleration of the corrective move.
Key Levels:
Major Supply (Resistance): 82,400. This level was a prior support and a consolidation high, now acting as a major resistance.
Major Demand (Support): 81,800 - 82,000. This is the most critical support zone. It represents a large FVG (Fair Value Gap) and a prior breakout level. A break below 81,800 would turn the 4H chart fully bearish.
1-Hour Chart (Intermediate View)
Structure: The 1H chart shows a clear continuation of the MSS (Market Structure Shift) to the downside. The price is trading within a descending channel and has consistently made lower highs and lower lows. The market closed below its immediate horizontal support, indicating strong selling pressure.
Key Levels:
Immediate Resistance: 82,000. This is the key psychological and technical level the bulls must reclaim.
Immediate Support: 81,600. This is the next support level that the market is likely to test.
15-Minute Chart (Intraday View)
Structure: The 15M chart confirms the strong intraday downtrend. The price broke the 82,000 psychological support and bounced back to retest the broken level before falling again (classical breakdown pattern). The index closed near its lows, confirming bearish control.
Key Levels:
Intraday Supply: 82,000 - 82,200 (Order Block and psychological resistance).
Intraday Demand: 81,600. This is the immediate support level.
Outlook: The intraday bias is strongly bearish. A "sell on rise" strategy is favored as long as the price trades below 82,000.
Trade Plan (Thursday, 25th September)
Market Outlook: The Sensex is in a clear short-term bearish phase. The primary strategy should focus on shorting on strength or breakdown.
Bearish Scenario (Primary Plan)
Justification: The breakdown of the 82,000 support is a significant bearish signal, confirming the short-term downtrend.
Entry: Short entry on a successful retest of the 82,000 level and rejection (sell on rise). Alternatively, a decisive break and 15-minute close below 81,600 would be a breakdown entry.
Stop Loss (SL): Place a stop loss above 82,250 (above the recent OB).
Targets:
T1: 81,600 (Immediate support/breakdown trigger).
T2: 81,400 (Next major demand zone).
T3: 81,200 (Extension target).
Bullish Scenario (Counter-Trend Plan)
Justification: This is a counter-trend plan and should be approached with caution. It is based on a potential strong short-covering bounce.
Trigger: A strong bullish reversal candle (e.g., engulfing) or a sustained move and close above 82,200.
Entry: Long entry above 82,200.
Stop Loss (SL): Below 82,000.
Targets:
T1: 82,400 (Recent swing high and resistance).
T2: 82,600 (Next major supply zone).
Key Levels for Observation:
Immediate Decision Point: The 81,800 - 82,000 zone.
Bearish Confirmation: A break and sustained move below 81,800.
Bullish Confirmation: A recapture of the 82,000 level.
Line in the Sand: 81,800. A break below this level is a strong signal of short-term trend reversal.
Disclaimer
The information and publications are not meant to be, and do not constitute, financial, investment, trading, or other types of advice or recommendations supplied or endorsed by TradingView. Read more in the Terms of Use.
Disclaimer
The information and publications are not meant to be, and do not constitute, financial, investment, trading, or other types of advice or recommendations supplied or endorsed by TradingView. Read more in the Terms of Use.