📉 Technical Chart Overview
Metric Value/Zone
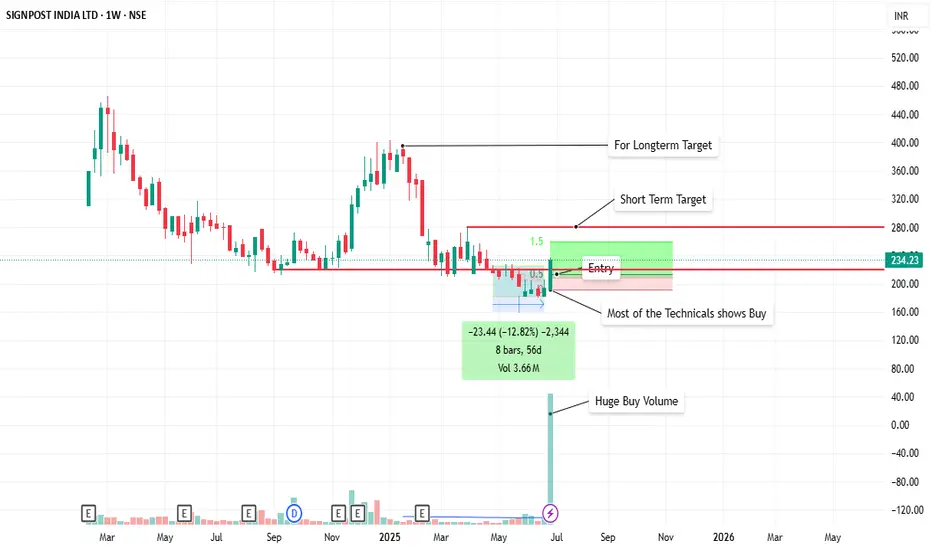
📆 Time Frame Weekly Chart (W1)
📈 Current Price ₹234.23
🟩 Entry Zone Around ₹200–210
🟥 Stop Loss Below ₹190 (recent support base)
🎯 Short-Term Target ₹280 (approx +20%)
🎯 Long-Term Target ₹360–400 (approx +50%–70%)
🔊 Volume Signal Huge Buy Volume spike
✅ Bullish Signals
📊 Volume Breakout: Last weekly candle has massive volume, indicating strong institutional or smart money interest.
🟢 Break from Consolidation Zone: Price broke out of a narrow range with a strong green candle.
📈 Bollinger Band Expansion: Price broke upper band after tight squeeze = volatility breakout
📉 Prior Downtrend Exhaustion: 56-day (8-week) accumulation range shows possible base formation
🔁 Buy zone confluence with previous support area (₹190–210)
📋 Trade Setup Summary
Category Details
📥 Entry ₹200–210
🛡️ Stop Loss Below ₹190 (weekly close)
🎯 Target 1 ₹280 (Short-Term)
🎯 Target 2 ₹360–400 (Positional / Long-Term)
⚖️ RRR ~1:2 or 1:3 based on targets
🚨 Caution Points
⚠️ Illiquidity Risk: This is a smallcap/low-float stock, so large positions may not be ideal.
📉 If breakout fails and price closes below ₹190, trend reversal invalidates.
🕰️ Patience required — this is a weekly timeframe trade; may take weeks to play out.
🧠 Strategy Recommendation
Type View
📦 Positional Strong setup — can be trailed weekly
💼 Swing Trade Good for 20–30% return in 3–5 weeks
🚨 Risk Averse Consider booking 50% near ₹270–280
🔚 Final Thoughts
Volume + Base Formation + Breakout on a weekly chart is a powerful combination. If broader market support continues, SIGNPOST could be a multi-week runner.
Metric Value/Zone
📆 Time Frame Weekly Chart (W1)
📈 Current Price ₹234.23
🟩 Entry Zone Around ₹200–210
🟥 Stop Loss Below ₹190 (recent support base)
🎯 Short-Term Target ₹280 (approx +20%)
🎯 Long-Term Target ₹360–400 (approx +50%–70%)
🔊 Volume Signal Huge Buy Volume spike
✅ Bullish Signals
📊 Volume Breakout: Last weekly candle has massive volume, indicating strong institutional or smart money interest.
🟢 Break from Consolidation Zone: Price broke out of a narrow range with a strong green candle.
📈 Bollinger Band Expansion: Price broke upper band after tight squeeze = volatility breakout
📉 Prior Downtrend Exhaustion: 56-day (8-week) accumulation range shows possible base formation
🔁 Buy zone confluence with previous support area (₹190–210)
📋 Trade Setup Summary
Category Details
📥 Entry ₹200–210
🛡️ Stop Loss Below ₹190 (weekly close)
🎯 Target 1 ₹280 (Short-Term)
🎯 Target 2 ₹360–400 (Positional / Long-Term)
⚖️ RRR ~1:2 or 1:3 based on targets
🚨 Caution Points
⚠️ Illiquidity Risk: This is a smallcap/low-float stock, so large positions may not be ideal.
📉 If breakout fails and price closes below ₹190, trend reversal invalidates.
🕰️ Patience required — this is a weekly timeframe trade; may take weeks to play out.
🧠 Strategy Recommendation
Type View
📦 Positional Strong setup — can be trailed weekly
💼 Swing Trade Good for 20–30% return in 3–5 weeks
🚨 Risk Averse Consider booking 50% near ₹270–280
🔚 Final Thoughts
Volume + Base Formation + Breakout on a weekly chart is a powerful combination. If broader market support continues, SIGNPOST could be a multi-week runner.
Related publications
Disclaimer
The information and publications are not meant to be, and do not constitute, financial, investment, trading, or other types of advice or recommendations supplied or endorsed by TradingView. Read more in the Terms of Use.
Related publications
Disclaimer
The information and publications are not meant to be, and do not constitute, financial, investment, trading, or other types of advice or recommendations supplied or endorsed by TradingView. Read more in the Terms of Use.