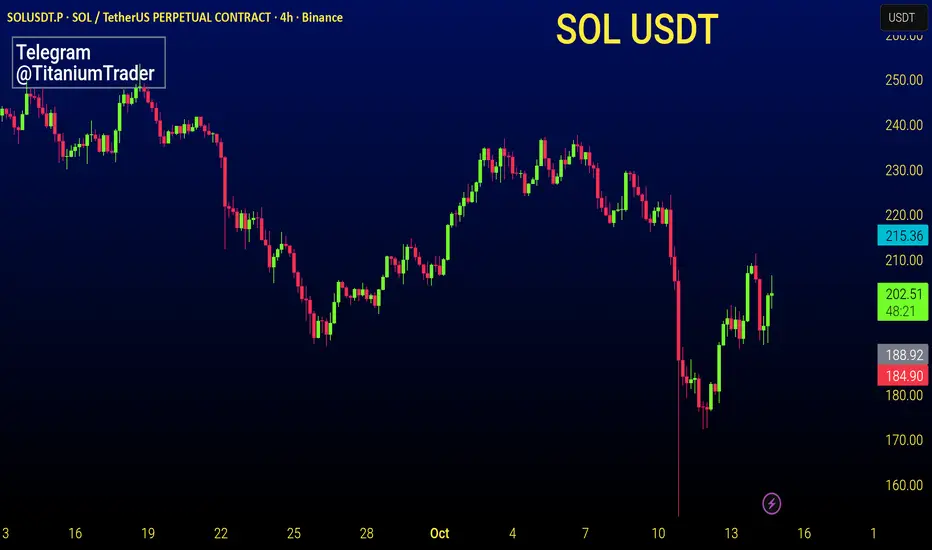
✅SOL 4-Hour Timeframe: Short-Term Price Dynamics
⚜️Solana (SOL) is currently trading around 202.49 USDT, showing consolidation after recent volatility. Over the past hour, price has fluctuated within a narrow range of 201.43 to 203.86 USDT, indicating short-term equilibrium between buyers and sellers. The highest volume spike occurred at 02:18, with over 66,000 USDT traded, coinciding with a minor rejection from the 203.80 zone.
⚜️In the last few cycles, SOL showed a brief breakdown below 200 USDT earlier in the session, sparking liquidations and bearish sentiment. However, strong buying pressure emerged near 198–199 USDT, pushing price back above 200 and forming a recovery pattern. This suggests that 198–200 USDT is acting as a strong support level in the near term.
✅Market Drivers & Immediate Outlook
⚜️Recent news highlights mixed signals — while some outlets reported SOL breaking above 200 USDT with a 4.49% gain, others noted a 4.27% drop when it briefly fell below. Despite this, on-chain activity and social sentiment remain active, with communities discussing Solana’s resilience and potential alpha opportunities amid broader market swings.
⚜️The 1-hour chart shows price now testing resistance near 203.80 USDT. A confirmed break above could open room toward 205–206 USDT. Conversely, failure to hold above 202 may lead to retesting support at 200.70–201.00 USDT.
t.me/ititaniumtrader
Disclaimer
The information and publications are not meant to be, and do not constitute, financial, investment, trading, or other types of advice or recommendations supplied or endorsed by TradingView. Read more in the Terms of Use.
t.me/ititaniumtrader
Disclaimer
The information and publications are not meant to be, and do not constitute, financial, investment, trading, or other types of advice or recommendations supplied or endorsed by TradingView. Read more in the Terms of Use.